

![]()
A 3D Virtual Reality Laboratory as a Supplementary Educational Preparation Tool for a Biology Course
Evgenia Paxinou [paxinou.evgenia@ac.eap.gr], Hellenic Open University [https://www.eap.gr/en/], Anthi Karatrantou [akarat@upatras.gr], University of Patras [http://www.cetl.elemedu.upatras.gr/staff-en.php], Dimitris Kalles [kalles@eap.gr], Hellenic Open University, Christos Panagiotakopoulos [cpanag@upatras.gr], University of Patras, Argyro Sgourou [sgourou@eap.gr], Hellenic Open University, Greece
Abstract
Most of the educational scenarios designed for the natural sciences’ courses a few decades ago, no longer appeal to the new generation of students who are growing up in a wide-spread technological environment. Today’s students expect that educational institutes will exploit technological innovations, such as virtual reality labs, so as to make them more enthusiastic and engaged in science courses. In this study the sample consisted of 67 third year undergraduate, distance learning students, enrolled in a Biology laboratory course in a Natural Science module. We investigated whether distance learning students, who participated in a Skype session and were familiarized with a 3D virtual reality biology lab: (a) were better prepared for the microscopy experiment performed in the wet lab than their fellow students who relied only on the regular resources, (b) acquired confidence for their knowledge compared to their fellow students and (c) obtained higher laboratory skilfulness in order to perform successfully and safely their experiment, later, in the wet lab, than their fellow students. Our results provide evidence that a virtual reality biology lab can be a promising supplementary educational tool for the distance learning students’ preparation, in general for laboratory courses, and mainly for the microscopy experiment performed in a biology lab.
Abstract in Greek
Στις Φυσικές Επιστήμες, τα περισσότερα εκπαιδευτικά σενάρια τα οποία έχουν σχεδιαστεί μερικές δεκαετίες πριν, δε φαίνονται πια τόσο ελκυστικά στη νέα γενιά των φοιτητών οι οποίοι μεγαλώνουν μέσα σε ένα τεχνολογικό περιβάλλον. Σήμερα οι φοιτητές περιμένουν ότι τα εκπαιδευτικά ιδρύματα στα οποία φοιτούν θα εκμεταλλευτούν τις τεχνολογικές καινοτομίες της σύγχρονης εποχής, όπως είναι τα εργαστήρια εικονικής πραγματικότητας, προκειμένου να τους εμπλέξουν περισσότερο στα μαθήματα της επιστήμης τους. Στην έρευνά μας χρησιμοποιήσαμε ένα δείγμα με 67 τριτοετείς προπτυχιακούς φοιτητές οι οποίοι σπούδαζαν εξ αποστάσεως και ήταν εγγεγραμμένοι σε ένα εργαστηριακό μάθημα Βιολογίας στις Φυσικές Επιστήμες. Ερευνήσαμε εάν οι εξ αποστάσεως φοιτητές οι οποίοι συμμετείχαν σε μία Skype συνεδρία και εξοικειώθηκαν με ένα εικονικό εργαστήριο Βιολογίας: (α) ήταν καλύτερα προετοιμασμένοι για το πείραμα μικροσκόπησης που θα έκαναν στο πραγματικό εργαστήριο, από ότι είναι οι συμφοιτητές τους οι οποίοι για την προετοιμασία τους βασίστηκαν μόνο στο συνηθισμένο εκπαιδευτικό υλικό, (β) απέχτησαν μεγαλύτερη σιγουριά για την ορθότητα της γνώσης που αφομοίωσαν, από ότι οι συμφοιτητές τους και (γ) κατείχαν περισσότερες εργαστηριακές δεξιότητες προκειμένου να πραγματοποιήσουν με επιτυχία και ασφάλεια το πείραμά τους αργότερα, στο πραγματικό εργαστήριο, από ότι οι συμφοιτητές τους. Τα αποτελέσματά μας παρέχουν αποδείξεις ότι ένα εργαστήριο εικονικής πραγματικότητας στη Βιολογία μπορεί να είναι ένα πολλά υποσχόμενο συμπληρωματικό εκπαιδευτικό εργαλείο για την προετοιμασία στο πείραμα της μικροσκόπησης, φοιτητών που σπουδάζουν εξ αποστάσεως.
Keywords: Learning Simulations, Virtual Reality, Biology Lab, Distance Learning Education, Assessment, Microscopy
Introduction
The advancement of information technology has an enormous impact on education (Collins, & Halverson, 2018; p.19; Rutten, van Joolingen & van der Veen, 2012). At the same time, online education is gathering pace and it is expected to continue further during the next decades (Allen & Seaman 2010). The main concern of institutions, particularly of those specialized in distance learning education, is to update their didactic models by adapting suitable developments of this technology to every aspect of their educational processes (Vick, 2012). Virtual Reality (VR) devices are becoming more and more mainstream. In 1992, when nobody had a clear idea of how VR would develop, Steuer claimed that VR is more than the technology (Steuer, 1992). Nowadays, this policy is principally adopted in educational research, which rather focuses on the virtual experience provided by VR technology than the actual technological achievements.
Virtual reality technology is very soundly apparent the last decades and intends to move forward the landscape of education in a very significant way. VR laboratories are a technological innovation and also the new online educational trend for communicating to students’ practical skills of science (Makransky et al., 2016). VR labs are also an educational tool that is compatible with the idea that learning is an active, interpretive, iterative process (Tobin, 1990). As a result, distance learning educational institutions often redesign their curriculum by incorporating VR lab related activities in their educational scenarios, to meet the expectation that such a simulation based learning environment will improve students’ knowledge on scientific subjects (Makransky, Thisgaard, & Gadegaard, 2016; Brinson, 2015).
Over the past decades several comparative research studies have attempted to investigate whether the use of physical manipulatives is more beneficial to students’ learning than the use of virtual manipulatives (Jimoyiannis & Komis, 2001; Stern, Barnea, & Shauli, 2008; Riess & Mischo, 2010). Review papers mention the research methodologies used in the area of adaptive systems like 3D Virtual Learning Environments (Scott, Soria, & Campo, 2017). The debate between the virtual and the wet lab is a long running one, since research has shown that wet labs play a unique role in scientific education whereas VL labs offers a serendipitous engaging experience (Ma & Nickerson, 2006; Hofstein & Mamlok-Naaman, 2007; Zafeiropoulos et al., 2014). Olympiou and Zacharia (2012) revealed that a blended educational scenario that includes a virtual and a physical lab enhances students’ conceptual understanding. Paxinou et al. (2018) reported that when a virtual lab is embedded to educational scenarios, students’ scores in written tests are increased. According to Bonde et al. (2014) there is a 76% increase in learning outcomes by using a gamified laboratory simulation and a 101% increased when used in combination with traditional teaching. De Jong, Linn and Zacharia (2013) stated that there is no significant difference between virtual and physical laboratories. Makransky (2016) reported that simulations must serve as a tool for preparation and not as a replacement for the physical lab in its entirety.
Usually, the comparison of the educational techniques is based on the grades that students get in Pre and Post Tests during the applied educational scenarios. Although grading methods and theories vary among countries, levels of education, departments and courses (Guliullina, 2016) most commonly, students’ written tests are graded with the Classical Test Theory (CTT) (Gulliksen, 1950). The Classical Test Theory, also known as the true score theory, refers to the analysis of test results based on test scores (Wu, Tam, & Jen, 2016; p.73). Although this grading theory is a traditional one, by using the CTT the educators possibly won’t be able to distinguish students who give confident correct answers from students who give answers randomly, based on uncertain knowledge. Due to the fact that lucky guess strategy is commonly used by students worldwide, a less classical but fairer grading method is sometimes utilized, the Confidence-Based Marking (CBM) that according to some researchers it moves towards deeper learning and better exams (Gardeneer-Medwin, 2006; p.141; Rosewell, 2016).
Laboratory exercises and practical experimentation are essential part of most Natural Sciences courses, where students obtain not only the conceptual knowledge but also some specific practical laboratory skills (Hofstein & Lunetta, 2003; Jimoyiannis, Mikropoulos, & Ravanis, 2000; Waldrop, 2013). Assessing students’ laboratory skills is a complex task, as these skills represent a combination of knowledge, perception of the lab environment and hand-on abilities. However, the successful performance of a laboratory exercise, for example of a microscopy procedure with a photonic microscope, can be a robust indicator that a student enrolled in a Biology course, has conquered all the necessary skills regarding microscopy. When assessing laboratory skills via the successful completion of a given experiment, it is more effective to divide the goal of the task into subgoals so as to ease the cognitive load (Diederen et al., 2005).
67 third year students enrolled to the undergraduate course “Studies in Natural Sciences” in a university which is mastering the distance learning education, were subjected to the present research protocol. This course structure has been developed upon distance learning methods and aims to provide students with an introduction to all fields of Natural Science, including Physics, Chemistry and Biology. Apart from the distance learning modules, during their studies, students also perform practical laboratory educational courses, where their physical appearance is mandatory. In our study the third year students attended the practical biology courses in biology lab. For their familiarization to the experiment on microscopy apart from the traditional method we also used the 3D VR biology laboratory educational tool, called OnLabs, (https://sites.google.com/site/onlabseap/). Our teaching methods were based on the educational scenarios proposed by Paxinou et al. (2018). The aim of the present study was to evaluate the following educational aspects:
- Whether the distance learning students were better prepared for their microscopy experiment when the use of a VR biology lab was introduced before the traditional training method for the biology lab course.
- What is the level of enhancement in students’ confidence, based on the preliminary preparation to the microscopy experiment by OnLabs and how this preparation accounted for their consciously correct answers to their Pre and Post Test.
- Whether a VR biology lab helps students obtain the basic laboratory skills, which are essential for a productive first contact experience with the wet lab.
This manuscript is structured in three subsequent sections. The next section is about the educational scenarios and the methods that are used in order to collect and analyse our data. In section 3 we demonstrate our evaluation outcomes and finally, in section 4 we emphasize on study conclusions and refer to future perspectives.
Method
We focused on the microscopy experiment, a commonly introducing experiment to the field of Biology. An initial contact with the participants was done via email through the university communication platform, where a detailed schedule of our project was presented. Students who agreed to participate were given two options of educational methods to follow: (a) the traditional teaching method of attending the laboratory course, after they have been prepared only by their lab book and (b) the proposed experimental method, which apart from the traditional teaching method included an introduction to microscopy via a Skype session and the use of the Biology VR lab, in an effort to familiarize them with their lab exercise. In detail, the traditional method required the careful reading of the Biology Text Book, (1st phase-Preparation), then the appearance to the wet lab to attend a half an hour face-to-face tutorial plus a live demonstration of the complete microscopy procedure, (2nd phase-Tutorial in the Wet Lab) and finally the use of a light microscope to focus on test specimens (3rd phase-Using the Microscope). The proposed teaching method included reading the Biology Text Book and participating in a Skype session where the VR biology lab was remotely demonstrated (1st phase-Preparation), then appearing to the wet lab to attend a half an hour face-to-face tutorial plus a live demonstration of a complete microscopy procedure, (2nd phase-Tutorial in the Wet Lab) and finally using a light microscope to focus on test specimens (3rd phase-Using the Microscope) (Figure 1).
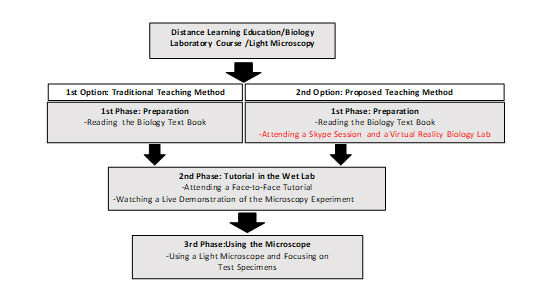
Figure 1. Schematical presentation of the traditional and the proposed teaching method
From the 67 students, 36 students chose to follow the traditional teaching method, (control group), and the rest 31 students, chose to follow the proposed teaching method (experimental group).
All students received the Biology Text Book via mail, four months before appearing in the wet lab. According to the students’ positive answer to the introductory question, “Have you read the microscopy chapter in the Biology Text book before appearing in the wet lab?” (Appendix B), a Pre Test and a Post Test were given to all students in order to evaluate the understanding of concepts in the domain of microscopy and a Work Sheet to assess their experimental skills (Figure 2).
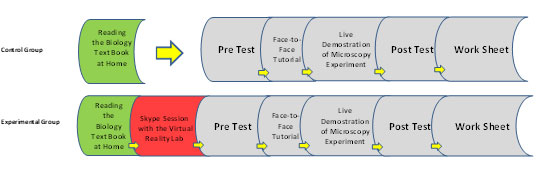
Figure 2. Pre Test, Post Test and Work Sheet embedded in the educational process
In this study the VR lab, OnLabs was utilized, which provides a realistic 3D biology laboratory environment (Zafeiropoulos & Kalles, 2016).
The 3D VR Biology Lab, OnLabs
OnLabs’ features are oriented towards its application to the training of distance learning students. It provides a high level of realism regarding microscopy, appropriate for the queries and the evaluations of our study. OnLabs offers three modes: (a) the Instruction Mode, (b) the Evaluation Mode and (c) the Experimentation Mode. Figure 3 represents a screen shot of the virtual environment of OnLabs, showing the laboratory bench with the optical microscope and related accessories to conduct the experiment. When a user chooses the Instruction Mode she/he performs under instructions, a complete microscopy procedure of a test specimen. The procedure is divided into steps and for each step a written instruction appears at the top of the screen (Figure 3(a), yellow arrow). In case the user cannot complete a step, she/he may click on the globe-button on the left corner of the screen (Figure 3(a), red arrow) and a written hint appears to his help. When the user completes a step successfully, she/he proceeds to the next.
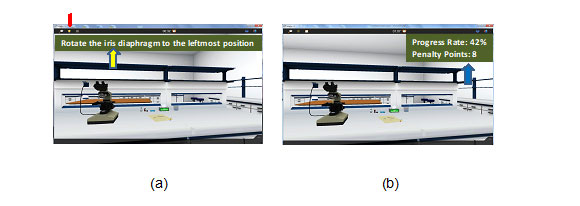
Figure 3. Screenshots of (a) the Instruction Mode and (b) the Evaluation Mode of OnLabs
By choosing the Evaluation Mode the user performs a complete microscopy without instructions. Through this mode she/he is also evaluated for her/his performance. Figure 3(b) presents a screenshot of the evaluation procedure. On the right top corner of the screen the user’s scores appear (Figure 3(b), blue arrow). The Experimentation Mode allows the user to perform a complete experiment without instructions and without evaluation. During this mode she/he can experiment and explore the function of the different parts of the microscope (photo not shown).
The Skype-Session with OnLabs
The Skype session took place two days prior to the students’ prescheduled appearance to their biology lab course. For this session we used the communication platform Skype for Business. The session lasted one hour and within that hour the Skype tutor presented the principals of microscopy and she also used the Experimental Mode of OnLabs to perform online a microscopy procedure. Snapshots of this Skype session are presented in Figure 4.
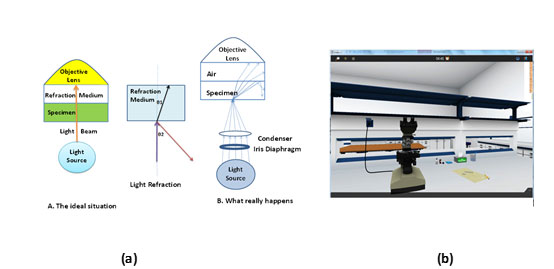
Figure 4. Educational material used in the Skype session (a) PowerPoint slides on microscopy principals and (b) Presentation of a microscopy procedure of a test specimen via the Experimental Mode of OnLabs
When the session was completed the tutor advised the students to practice on their own by using the Instruction Mode of OnLabs and also urged them to provide information concerning abnormal functions or potential difficulties derived from the OnLabs utilization.
It is notable, that although OnLabs had been uploaded to the students’ university communication platform, as a supplement to the traditional classroom resources, four months prior to the period that our research project occurred, none of the 67 students had used it on her/his own initiative [negative responses to the introductory query, “Have you used OnLabs on your own initiative?” (Appendix B)]. The fact that the baseline OnLabs-experience of all participants was nil, strengthened the confidence in the validity of our results and of the applied research protocol in this target group of students.
Assessment of the learning outcomes
The students’ understanding on the subject of microscopy was assessed through a Pre and a Post Test of 27 multiple choice questions. Both Pre and Post Test had exactly the same 27 questions. The Pre and Post Tests were graded in two ways, with: (a) the common Classical Test Theory method (CTT) and (b) the Confidence Based Marking (CBM).
The Confidence Based Marking method
In this study we endorse the belief that students must be prepared for viva situations where using their knowledge and making the right choice would be far more crucial than choosing between a, b or c from a multiple choice question in a Pre or Post Test. When a student’s score in a test is combined with his certainty for his knowledge, this combination appears as a more reliable estimator for the student’s substantial and real ability. Figure 5 visualizes, in a simplified way, the four possible categories in which a student could end up according the two dimensions, knowledge and confidence, (or more accurately, certainty) (Rosewell, 2016). In quadrant N°1 students have limited knowledge but they are not aware of their ignorance. In quadrant N°2 students have limited knowledge but the fact that they are aware of it, gives them the potential to improve themselves by putting more efforts. In quadrant N°3 students choose the correct answer probably by luck. Finally, in quadrant N°4 students possess the knowledge and additionally they can use it correctly. Undoubtedly, the ideal situation would be for the majority of the students to be categorized in quadrant N°4.
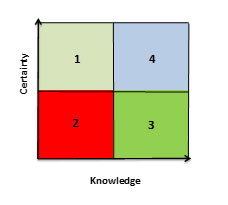
Figure 5. The four possible categories derived from the combination of knowledge and certainty (Rosewell, 2016)
Therefore, in this study we tried to clarify not only if a student had the knowledge but also how certain she/he was for his knowledge. In order to accomplish that, we enriched every multiple choice question in Pre and Post Test with a supplementary question asking for the certainty of the answer, (a small part of the administered Pre-Test is presented in Appendix B). Table 1 presents an example from the Pre Test.
Table 1: An example of a multiple choice question in the Pre Test, enriched with the certainty question
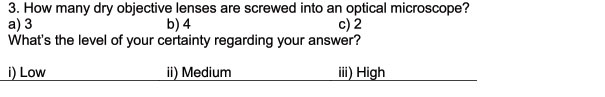
Table 2, presents the range of possible grades of student’s responses, naming this grades as student’s gain (g). For grading each answer, we considered significant both the rightness and the student’s certainty.
Table 2: Student’s gain values based on two parameters; the rightness of an answer and the student’s certainty
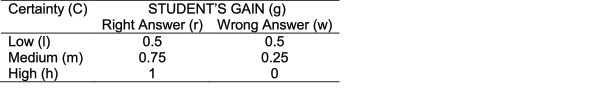
According to Table 2 student’s answers are graded with 1 only when the answer is correct and the certainty for the answer is high. Students who acquire a combination of a wrong answer but a high certainty that their answer is correct, get the lowest grade (zero). Students who give confidently wrong answers or uncertainly correct answers are evaluated with 0.5 points. A correct answer but of medium certainty gains 0.75 points.
By taking values from Table 2, we propose the following probabilistic model to calculate a student’s Knowledge-Certainty score (KC):
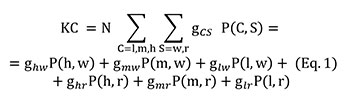
In a test of N questions, the KC score of a student is the sum over all possible values of certainty C (i.e., high-h, medium-m or low-l), of the sum of all possible values of the score S (i.e., right-r or wrong-w) of the terms containing the gain gCS and the joint probability P(C, S) multiplied by the total number of questions N. The gCS is a student’s gain if he answers a question with certainty C and gets a score of S, while P(C, S) is the percentage of the number of times that a student answers with certainty C and gets a score of S. For example, the first term ghwP(h, w) corresponds to that situation where a student answers P(h, w) wrongly (w) with high certainty (h) while he gets back as a gain this amount ghw for each one of these answers. In particular, P(h, w) denotes the percentage of the total questions in a test that a student answers wrongly but with high certainty.
Assessment of the Experimental Skills
Finally, an assessment of the students’ gained experimental skills was conducted. In detail, all students were asked to perform by themselves, in their wet lab, a complete microscopy procedure by using a real photonic microscope. The whole task was divided in 22 steps (22 subgoals). The goal of the task was divided into subgoals for two main reasons: (a) so as to lower the cognitive load (Diederen et al., 2005) and (b) so as to be able to track down the difficult steps when dealing with the photonic microscope.
The instructions of these 22 steps were printed in a work sheet (Appendix A) and each time the students completed a step they circled one of the three possible statements, as shown in the example given in Table 3. The students circled option (1) if they did the specific step easily, option (2) if they did the step after putting a lot of effort and option (3) if they couldn’t do the step by themselves and asked the educator to help them. During this assessment, in the biology lab, five tutors were supervising to offer their help.
Table 3: A sample of the work sheet designed to assess students’ experimental skills on microscopy
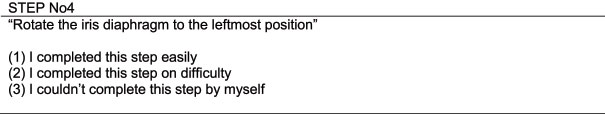
The ideal situation was accomplished when the students completed successfully the microscopy procedure by circling option (1) in all 22 steps. This was an undoubting indication that these particular students had become skilful on microscopy through the teaching method that they had initially chosen to follow.
Results
In the next subsections we present our research results based on the methods previously explained. Our results derived by the statistical analysis of the data (students’ scores). The Shapiro-Wilk test for Normality showed that our data do not follow the normal distribution (0.887 < W < 0.930, p < 0.05). Therefore, non-parametric statistical tests were used to detect statistically significant differences between and within the control and the experimental group. The Mann-Whitney U Test for independent samples, the Wilcoxon Signed Rank Test for related samples and the Chi-Square Test were used, (Johnson & Christensen, 2008; Bluman, 2011).
Assessment of the learning outcomes – Classical Test Theory Method
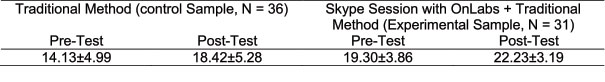
By looking at the students’ scores in Pre and Post Test in Table 4, it was noticeable that:
- The experimental group of students, exhibited statistically significant higher scores in the Pre Test than the control group (U = 823, p < 0.005). This was a direct indication that the experimental group was better prepared for the microscopy experiment than the control group and that the initial knowledge offered only by the Biology Text Book was not sufficient for the students’ preparation for their microscopy experiment. The Skype session and the introduction of the VR lab prior to the wet lab, appears as a useful supplement to the traditional resources.
- The Post Test scores of the control group, were statistically significant higher than the scores in the Pre Test (W = 596, p < 0.001). More specifically, there was a total 26% increase in the scores. The Post Test scores of the experimental group, were also statistically significant higher than the scores in the Pre Test (W = 394, p < 0.001). In more details, there was a 15.7% increase in the scores. These results indicated that the face-to-face tutorial and the live demonstration of the experiment enhanced students’ knowledge in both groups and offered efficiently, additional knowledge.
- The experimental group had statistically significant higher scores in the Post-Test than the control group, (U = 806, p < 0.001) although there was a 26% increase in the scores between the Pre and the Post Test for the control group and a lower increase of 15.7% increase for the experimental group. This indicates that the participation in the Skype session gave to the experimental group the lead also in the Post Test.
Table 4: Averages and standard deviations of students’ scores in Pre and Post Test, using the CTT grading, (10 is the grade for a flawless test)
Assessment of the learning outcomes – Confidence Based Marking Method
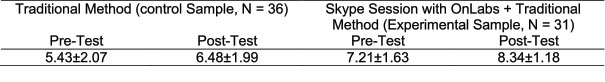
According to Table 2, the highest score a student can get in the Pre or the Post Test of the 27 multiple-choice questions is 27, as for each correct answer with high certainty, the score is 1. Table 5 presents the students’ Knowledge-Certainty scores in their Pre and Post Test.
Table 5: Averages and standard deviations of students’ Knowledge-Certainty scores in Pre and Post Tests, (the maximum grade is 27)
By looking at the students’ scores in Pre and Post Test, in Table 5 it was noticeable that:
- The Pre-Test scores for the experimental group were statistically significant higher than the Pre-Test scores for the control group (U = 841.5, p < 0.005). This indicates that the familiarization with the microscopy topic via the Skype session and OnLabs gave not only a significant preliminary knowledge on the subject, but also higher degree of certainty in that knowledge.
- The Post-Test scores for the control group were statistically significant higher than the Pre-Test scores (W = 600.5, p < 0.001). The Post-Test scores for the experimental group were also statistically significant higher than the Pre-Test scores (W = 448.5, p < 0.001). The face-to-face tutorial and the live demonstration of the experiment enhanced students’ certainty in their knowledge in both groups.
- The Post-Test scores for the experimental group were statistically significant higher than the Post-Test scores for the control group, (U = 773.5, p < 0.005). The higher preliminary knowledge and the higher certainty for the experimental group led to higher scores after the face-to-face tutorial and the live demonstration of the experiment, proving once more the importance of the Skype session and the OnLabs utilization as a supplement to the traditional preparation phase.
Assessment of the Experimental Skills
Students who did not participate in the Skype session and did not use OnLabs additionally to the traditional educational method, circled twice as many times option (3), as they could not complete several steps by themselves and they asked for help (Figure 6). The chi-square test showed that the differences between the two groups are statistically significant (x2 = 20.88, p < 0.001).
As Figure 6(b) demonstrates, the students who did not participate in the Skype session with the VR lab, circled option (3) and asked for help 3.3 times more than their fellow students who had this VR lab experience.
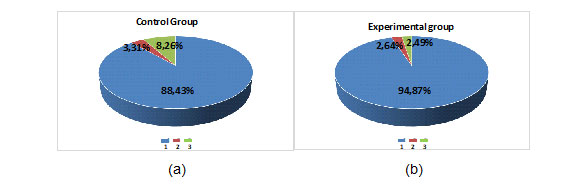
Figure 6. Assessment of the students’ experimental skills in the wet lab. The control group (a) and the experimental group (b) conducted a microscopy experiment which was divided in 22 steps. After carrying out each step, the students chose between: (1) I completed this step easily (2) I completed this step on difficulty (3) I couldn’t complete this step by myself
Conclusions
This study presents data from a class of 67 third year undergraduate distance learning biology students subjected to an experimental educational scenario. The class was divided into two groups: the control group that was traditionally prepared for the microscopy experiment in the wet lab only by reading the Biology Text Book, and the experimental group that not only did it read the Biology Text Book, but also participated in a Skype session and familiarized with a VR biology lab. In order to investigate which of the two groups managed to obtain knowledge, certainty of the obtained knowledge and experimental skills on microscopy, we compared the students’ answers in written tests and a work sheet. Our study highlighted the following points:
- The experimental group was better prepared and had higher initial knowledge on microscopy when it appeared in the wet lab.
- The experimental group was more certain about the possessed knowledge on microscopy when it appeared in the wet lab.
- Although the control group presented a higher increase in the scores between the Pre and the Post Test, the experimental group had finally higher scores in the Post Test than the control group.
- The experimental group obtained a bigger percentage of the laboratory skills pursued by a biology student, than the control group.
This study highlighted the simulation based learning environment of the 3D virtual laboratory as a promising alternative method for their preparation, especially for distance learning students, who have very limited opportunities to visit and practice their experiments in a biology lab.
Further Work
Although this study provides an initial evidence that a VR Biology laboratory can ensure better preparation for the wet lab, certainty in knowledge and experimental skilfulness, future research should be done comparing groups of students, from a wider selection of educational institutes and in different modules. Additionally, a future aim could be the investigation of whether the elevated certainty of knowledge and experimental skilfulness are not only associated with the fact that a VR application may facilitate students’ understanding, but also with the motivation, the interest and the sense of satisfaction that potentially stems from the use of a modern, innovative and easy to use application such a VR biology lab.
References
- Allen, I.E., & Seaman, J. (2010). Learning on Demand: Online education in the United States, 2009 (1st ed.). Newburyport, MA: Babson Survey Research Group and the Sloan Consortium.
- Bloom, B. S. (1956). A taxonomy of educational objectives, handbook 1: Cognitive domain. New York: Longman.
- Bluman, A. G. (2011). Elementary Statistics – A Step by Step Approach (8th ed.). Boston: McGraw-Hill.
- Bonde, M., Makransky, G., Wandall, J., Larsen, M. V., Morsing, M., Jarmer, H., & Sommer, M. O. A. (2014). Improving biotech education through gamified laboratory simulations. Nature Biotechnology, 32(7), 694-697.
- Brinson, J. R. (2015). Learning outcome achievement in non-traditional (virtual and remote) versus traditional (hands-on) laboratories: A review of the empirical research. Computers & Education, 87, 218-237.
- Collins, A., & Halverson, R. (2018). Rethinking education in the age of technology (2nd ed.) (pp. 2-22). New York and London: Teachers College Press.
- De Jong, T., Linn, M. C., & Zacharia, Z.C. (2013). Physical and virtual laboratories in science and engineering education. Science, 340(6130), 305-308.
- Diederen, J., Gruppen, H., Hartog, R., & Voragen A. G. J. (2005). Design and Evaluation of Digital Learning Material to Support Acquisition of Quantitative Problem-Solving Skills Within Food Chemistry. Journal of Science Education and Technology, 14, 495-507.
- Gardner-Medwin, A. R. (2006). Confidence-based marking, towards deeper learning and better exams. In Bryan C. & Clegg K. (Eds.), Innovative Assessment in Higher Education (pp. 141-149). London and New York: Routledge.
- Guliullina, L. (2016). The Impact of Initial Grades on students’ Further Academic Achievement. Department of Economics, School of Business and Economics, Maastrich University. Retrieved February 4, 2018, from http://2016.economicsofeducation.com/user/pdfsesiones/130.pdf
- Gulliksen, H. (1950). Theory of mental test. New York: John Willey & Sons Inc.
- Hofstein, A., & Lunetta, V. N. (2003). The laboratory in Science Education: Foundations for The Twenty-First Century. Science Education, 88(1), 28-54.
- Hofstein, A., & Mamlok-Naaman, R. (2007). The laboratory in Science education: the state of the art. Chemistry Education Research and Practice, 8(2), 105-107.
- Jimoyiannis, A., Mikropoulos, T. A., & Ravanis, K. (2000). Students’ performance towards computer simulations on kinematics. Themes in Education, 1(4), 357-372.
- Jimoyiannis, A., & Komis, V. (2001). Computer simulations in physics teaching and learning: a case study students’ understanding of trajectory motion. Computers & Education, 36(2), 183-204.
- Johnson, B., & Christensen, L. (2008). Educational research: Quantitative, qualitative, and mixed approaches. CA: Sage Publications.
- Ma, J., & Nickerson, J. V. (2006). Hands-On, Simulated, and Remote Laboratories: A Comparative Literature Review. ACM Computing Surveys, 38(3), Article No 7. Retrieved from https://web.stevens.edu/jnickerson/ACMComputingSurveys2006MaNickerson.pdf
- Makransky, G., Bonde, M. T., Wulff, J. S. G., Wandall, J., Hood, M., Creed, P. A., Bache, I., Silahtaroglu, A., & Norremolle, A. (2016). Simulation based virtual learning environment in medical genetics counseling: an example of bridging the gap between theory and practice in medical education. BMC Medical Education, 16(98). doi: 10.1186/s12909-016-0620-6
- Makransky, G., Thisgaard, M. W., & Gadegaard, H. (2016). Virtual Simulations as Preparation for Lab Exercises: Assessing Learning of Key Laboratory Skills in Microbiology and Improvement of Essential Non-Cognitive Skills. PLOS ONE 11(6): e0155895. Retrieved February 4, 2018, from http://journals.plos.org/plosone/article?id=10.1371/journal.pone.0155895
- Olympiou. G., & Zacharia, Z.C. (2012). Blending Physical and Virtual manipulatives: An Effort to Improve Students’ Conceptual Understanding Through Science Laboratory Experimentation. Science Education, 96(1), 21-47.
- Paxinou, E., Zafeiropoulos, V., Sypsas, A., Kiourt, C., & Kalles, D. (2018). Assessing the Impact of Virtualizing Physical Labs. Proceedings of the EDEN 2018 Annual Conference, 17-20 Jun., Genova, Italy, 151-158.
- Riess, W., & Mischo, C. (2010). Promoting systems thinking through biology lessons. International Journal of Science Education, 32(6), 705-725.
- Rosewell, J. (2016). Assessing with confidence. EMPOWER. Retrieved February 4, 2018, from https://www.youtube.com/watch?v=zKEJZxeLv3g
- Rutten, N., van Joolingen, W. R. & van der Veen, J.T. (2012). The learning effects of computer simulation in science education. Computers & Education, 58(1), 136-153.
- Scott, E., Soria, A., & Campo, M. (2017). Adaptive 3D Virtual Learning Environments-A Review of the Literature. IEEE Transactions on Learning Technologies, July-Sep. 2017, 10(3), 262-267. https://doi.org/10.1109/TLT.2016.2609910
- Stern, L., Barnea, N., & Shauli, S. (2008). The effect of a computerized simulation on middle school students’ understanding of the kinetic molecular theory. Journal of Science Education and Technology, 17(4), 305-315.
- Steuer, J. (1992). Defining Virtual Reality: Dimensions Determining Telepresence. Journal of Communication, 42, 73-93.
- Tan, P-N., Steinbach, M., & Kumar, V. (2006). Introduction to Data Mining. Boston: Pearson, Addison Wesley.
- Tobin, K. G. (1990). Research on science laboratory activities. In pursuit of better questions and answers to improve learning. School Science and Mathematics, 90, 403-418.
- Vick, M. (2012). Analyzing Breadth and Depth of a Virtual Charter School’s Science Curriculum. US-China Education Review, A2, 149-163. Retrieved February 4, 2018, from https://files.eric.ed.gov/fulltext/ED532171.pdf
- Waldrop, M. M. (2013). Educational Online: The virtual lab. Nature, 499, 268-270.
- Wu, M., Tam, H. P., & Jen, T-H. (2016). Educational Measurement for Applied Researchers: Theory into Practice. Singapore: Spinger.
- Zafeiropoulos, V., &
Kalles, D. (2016). Performance Evaluation in Virtual Lab Training. Proceedings
of the Online, Open and Flexible Higher Education Conference. Rome, Italy, 455-468.
Retrieved from https://empower.eadtu.eu/images/report/The_Envisioning_Report_for_Empowering_
Universities_1st_edition_2017.pdf - Zafeiropoulos, V., Kalles, D., & Sgourou, A. (2014). Adventure-Style Game-Based Learning for a Biology Lab. Proceeding of the IEEE 14th International Conference on Advanced Learning Technologies. Athens, Greece. doi: 10.1109/ICALT.2014.195
Appendix A
Work Sheet (Assessment of the Experimental Skills)
Student’s ID: ……………
Date: …………….
Instructions: Use the photonic microscope and the given specimen to perform a complete microscope procedure by following the steps written in this work sheet, in the given order. After completing each step please circle one of the three statements written below.
STEP 1
Connect the plug of the microscope into the nearest socket
(1) I completed this step easily
(2) I completed this step on difficulty
(3) I couldn’t complete this step by myself
STEP 2
Turn the light on
(1) I completed this step easily
(2) I completed this step on difficulty
(3) I couldn’t complete this step by myself
STEP 3
Adjust the light intensity all the way to 18
(1) I completed this step easily
(2) I completed this step on difficulty
(3) I couldn’t complete this step by myself
STEP 4
Rotate the iris diaphragm to the leftmost position
(1) I completed this step easily
(2) I completed this step on difficulty
(3) I couldn’t complete this step by myself
STEP 5
Lift the condenser knob up to its highest point
(1) I completed this step easily
(2) I completed this step on difficulty
(3) I couldn’t complete this step by myself
STEP 6
Rotate the revolving nosepiece so as to set the objective lens with the lowest magnification into position
(1) I completed this step easily
(2) I completed this step on difficulty
(3) I couldn’t complete this step by myself
STEP 7
Place the specimen on the stage and stabilize it with the stage clips
(1) I completed this step easily
(2) I completed this step on difficulty
(3) I couldn’t complete this step by myself
STEP 8
Enter the microscoping mode by looking through the eyepieces. Move your specimen by rotating the stage and the specimen knob so as your specimen gets in the light path
(1) I completed this step easily
(2) I completed this step on difficulty
(3) I couldn’t complete this step by myself
STEP 9
Find the appropriate position for the eyepieces by rotating them
(1) I completed this step easily
(2) I completed this step on difficulty
(3) I couldn’t complete this step by myself
STEP 10
Turn the coarse focus knob to move the stage upwards until the image comes into focus. Then use the fine focus knob for better adjustment. Ask for your supervisor to come and verify your focus
(1) I completed this step easily
(2) I completed this step on difficulty
(3) I couldn’t complete this step by myself
STEP11
Rotate the revolving nosepiece to set 10X objective lens into position
(1) I completed this step easily
(2) I completed this step on difficulty
(3) I couldn’t complete this step by myself
STEP 12
Focus on your specimen. Ask for your supervisor to verify your focus
(1) I completed this step easily
(2) I completed this step on difficulty
(3) I couldn’t complete this step by myself
STEP 13
Rotate the revolving nosepiece to set 40X objective lens into position
(1) I completed this step easily
(2) I completed this step on difficulty
(3) I couldn’t complete this step by myself
STEP 14
Focus on your specimen. Ask for your supervisor to verify your focus
(1) I completed this step easily
(2) I completed this step on difficulty
(3) I couldn’t complete this step by myself
STEP 15
Rotate the revolving nosepiece to set 100X objective lens into position
(1) I completed this step easily
(2) I completed this step on difficulty
(3) I couldn’t complete this step by myself
STEP 16
Focus gently on your specimen. Ask for your supervisor to verify your focus
(1) I completed this step easily
(2) I completed this step on difficulty
(3) I couldn’t complete this step by myself
STEP 17
Rotate the revolving nosepiece to set 4X objective lens again into position
(1) I completed this step easily
(2) I completed this step on difficulty
(3) I couldn’t complete this step by myself
STEP 18
Remove the specimen from the stage
(1) I completed this step easily
(2) I completed this step on difficulty
(3) I couldn’t complete this step by myself
STEP 19
Rotate the iris diaphragm to the rightmost position
(1) I completed this step easily
(2) I completed this step on difficulty
(3) I couldn’t complete this step by myself
STEP 20
Adjust the light intensity all the way to zero
(1) I completed this step easily
(2) I completed this step on difficulty
(3) I couldn’t complete this step by myself
STEP 21
Turn the light switch off
(1) I completed this step easily
(2) I completed this step on difficulty
(3) I couldn’t complete this step by myself
STEP 22
Disconnect the power cord from the socket
(1) I completed this step easily
(2) I completed this step on difficulty
(3) I couldn’t complete this step by myself
WELL DONE! THE MICROSCOPY PROCEDURE IS COMPLETED!
STORE YOUR SPECIMEN, CLEAN THE LENSES, COVER YOUR MICROSCOPE AND
PLACE IT IN ITS CABIN
Appendix B (A part of the Pre-Test)
Student’s ID: ……………………..
Have you read the microscopy chapter in the Biology Text Book before appearing in the wet lab? Yes□ No□
Did you take part in the Skype-session? Yes□ No□
Have you used OnLabs on your own initiative? Yes□ No□
QUESTIONS
1. What is the minimum size of a structure that a human eye can see from a distance of 25cm:
a) 20mm b) 1mm c) 0,1mm
What’s the level of your certainty regarding your answer?
i) Low ii) Medium iii) High
2. How many dry objective lenses are screwed into an optical microscope?
a) 3 b) 4 c) 2
What’s the level of your certainty regarding your answer?
i) Low ii) Medium iii) High
3. By using a photonic microscope and while focusing on a protozoon, you realize that the protozoon is moving to the right. Where the protozoon is actually moving to?
a) To the right b) To the left c) We don’t really know
What’s the level of your certainty regarding your answer?
i) Low ii) Medium iii) High
4. When cells are stained with various dyes certain internal structures stand out by:
a) Increasing contrast b) Increasing resolution c) Reducing contrast
What’s the level of your certainty regarding your answer?
i) Low ii) Medium iii) High
5. If the Limit of Resolution of a microscope is about 0,3μm then two cell structures are distinguished as being separated if they have been spaced:
a) 0,2μm apart b) 0,4μm apart c) 0,6μm apart
What’s the level of your certainty regarding your answer?
i) Low ii) Medium iii) High