

![]()
Financial Operations of Distance Education and Campus-Based Education: A Zambian Case
Anna Bucheba Chakupalesa [chakupalesa_annab@yahoo.co.uk],
Nkrumah College of Education, Zambia
Santosh Panda [spanda@ignou.ac.in],
Indira
Gandhi National Open University, India
Abstract
Distance education is often hailed as the answer to the worlds problems of educational provision particularly in the developing countries of which African governments are no exception. Distance education has been used for both pre-service and in-service education, and at most levels of education. However, other than the structural differences between the distance education system and the conventional educational system, there is an economic dimension too. Claims are made that distance education can improve the access to, and the quality of, educational provision at a lower unit cost. It is in this vein that a case study was undertaken in order to make a comparative analysis of the financial operations of the two education systems – distance education and conventional education – of Nkrumah College of Education of Kabwe, Zambia.
The study captured the views and experiences of respondents and analysed numerical figures. In order to achieve the above stated objectives, the sampled respondents and documents were drawn from the two systems of Nkrumah College of Education. Primary information was gathered from the accounting staff and administrators of Nkrumah College of Education, using a self-designed questionnaire and interview schedule. Secondary information was obtained from documentary analysis of the financial records of Nkrumah College of Education.
It was found that the unit cost, i.e. cost per graduate was lower in the distance education system than in the conventional education system. With regard to funding of the two systems, this study established that student fees were the sole source of finances for the distance education system whilst the conventional system was financed by various sources other than student fees: grants from the government, private sector/NGOs, international funding agencies, and from sale of materials and services. The study also established that the government did not fund the distance education system at NCE; rather the distance learners financed the entire operations of the distance education system. Arising from the findings of this study, various recommendations have been made, including the need for the government to offer some funding to the distance education system so that student fees may not be beyond the reach of the neediest for whom the distance education system is mainly intended.
Keywords: Financing of education, funding of distance education, funding of campus education, comparative study of distance and campus education, distance education in Zambia
Introduction
The Nkrumah College of Education (NCE) is situated about 3 km from the town centre of Kabwe in the Central Province of Zambia. NCE is a teacher training college which was opened in 1965 to offer three-year junior teacher diploma programmes.
As elsewhere in Africa, the policy of the Zambian government was to progress towards the localization of the secondary school teaching force. In the meantime, the country was largely opened up to expatriates for their operations. The position in Government schools as of February 1968, with regard to localization (Zambianisation) was as follows: 117 Zambian teachers and 1213 Non-Zambian teachers (OVP, 1969).
Graduates from NCE were in theory expected to teach at junior secondary level, i.e. grades 8 and 9. However, “because of the shortage of university-graduates, especially in Mathematics, Science and English, diploma-holders from N.C.E. may be required to teach Grade 10 -12 classes” (MoE, 1996:111).
This aspect depleted the junior secondary/basic sector of qualified teachers who were now handling the senior secondary, grades 10-12. The junior secondary levels (grades 8-9) were thus being handled by unqualified primary school teachers seconded to teach these grades. This was worsened by the fact the teacher attrition doubled in 2005 compared to 2004 (from 2,195 in 2004 to 4,965 in 2005). The 2006 Educational Statistics reported that a total of 7,768 teachers left the teaching service. The most common reasons given for the attrition were those of illness, teachers being given non-teaching jobs, retirements and resignations (CEF, End of Project Evaluation Report – 2000:1).
In the early 1970s, in a bid to meet the teacher demand due to the rapid expansion of the secondary schools and particularly the universal basic education policy, the three year programme was reduced to two years. This was undertaken to try and meet the teacher requirement not only in the basic sector, but also in the secondary sector which could not be fulfilled by the University of Zambia alone. The Directorate of Teacher Education and Specialised Services (TESS) of the government worked out availability of teachers from the level of current training capacity from 2007 to 2009 as follows (Table 1).
Table 1: Availability of teachers
Demand |
Supply |
Gap |
|
Basic (1-7) |
42,081 |
48,000 |
+5,919 |
Upper Basic (8-9) |
17,390 |
8,800 |
-8,590 |
High Schools |
5,039 |
1,200 |
-3,839 |
Total |
64,510 |
58,000 |
-6,510 |
(Source: Teacher Education Transformations, March, 2009, p.6)
It was quickly realised that the conventional pre-service training at NCE could not train the large number of unqualified serving teachers needed to cope with the increasing basic and high school enrolment. Deaths of teachers owing to the HIV/AIDS pandemic were another factor that drastically reduced the number of teachers. The National Policy on Education (MoE, 1996:75) reveals that:
“A further dimension of the HIV/AIDS problem is the fact that teachers fall within the education and age groups that are most vulnerable to infection. The profession has already seen the loss of many of its members and may lose many more Such losses make it increasingly difficult to ensure that existing schools are fully staffed by qualified teachers and reduce the potential for extending educational provision to all eligible children. This consideration underscores how important it is that the ministry adopts a variety of strategies at increasing the supply of qualified teachers.”
Furthermore, it was noted that as with many developing countries, population was on the increase despite their economies performing badly. This further made the provision of conventional training difficult. The government found distance education cheaper since teachers paid for their own tuition (Haambokoma and Chabalengula, 2003:623).
The National Policy on Education (MoE, 1996:116) shows that, “The Ministry’s capacity to offer in-service training programmes is quite limited. In 1994, only 1 % of serving teachers underwent formal training of one kind or another”. Hence, the NCE adopted distance education as one of the strategies at increasing the supply of qualified teachers. It started delivering the first national distance training programme for teachers in January, 1997. The Secondary Teachers’ Diploma offered by the NCE was a two-year programme in the conventional system. The NCE-DE provided an alternative but equivalent route to this Secondary Teachers’ Diploma for working primary school teachers in a country very short of qualified teachers and where conventional college output could not meet demand.
The mission of the NCE-DE programme was to upgrade the quality of teachers through the distance education. Its courses and qualifications were equivalent to those of the conventional system, though the duration was longer, i.e. three years (the college-based equivalent took the two years). The curriculum covered general and specialist academic subjects, education, field trips, peer teaching and three months of supervised teaching practice. Learner support was provided at two weeks compulsory face-to-face sessions every three months. The students attended them for tutorials, revision and examination sessions, and received three packages of modules for each subject/course (one per term) comprising the course itself, exercises for self-correction and an assignment (control exercise) which had to be returned to the institution, NCE. The supervision of teaching practice was carried out by both the parent institution and local higher education institutions that visit students at least four times during the three-month period and assess them against standardised performance-based assessment criteria. Continuous assessment, tests and practicals constituted 40 % of the final grade; and examinations formed 60 %. Teaching practice was compulsory but to qualify for it, students have to attain a grade of 40 % in course work.
Accreditation and quality control for all NCE programmes, including the NCD-DE, is undertaken by the University of Zambia (UNZA). This body visits centres, appraises the quality and quantity of tutors, and sets the grading and assessment system. The teaching practice and examinations are externally moderated. The learning materials are acknowledged to have a value wider than the distance education programme alone and have been used in other countries (e.g., Botswana, Kenya, Malawi, Zimbabwe).
Quality assurance measures includes, besides external assessment of courses and modules, external moderation of question papers and examination scripts, the provision by the students’ workbooks recording their activities and lesson plans. Quality assurance measures for both the systems – the conventional system and the DE system – of NCE are basically the same and are undertaken by the same body-UNZA. So, in both the systems of NCE, quality is maintained and upheld. It was against this background that the study was undertaken. This study was aimed at evaluating and describing the financial implications of producing high school teachers using the two systems – Distance Education system and the Conventional system – of Nkrumah College of Education. In this regard, the study analysed the financial operations of the two systems. A comparative analysis of the two systems was made to determine which system was more cost effective system. The study further aimed to make relevant recommendations to educational planners, policy makers and institutional leaders with a view of augmenting the least expensive and more cost effective system. This is in view of the fact that the majority of basic and high schools are yet to be covered by teachers of acceptable quality.
The D.E. system in NCE had been in operation since January, 1997 to December, 2008 when it was discontinued by the relevant authorities citing various reasons prominent of which was in relation to cost effectives of the programme.
Effective utilization of financial resources, besides effective utilization of facilities and infrastructure, is one of the indicators of cost effectiveness of a system.
The study used, “cost per graduate” i.e. the unit cost of a graduate in the conventional system and the unit cost of the graduate in the D.E. system, undertaking similar course in the period 2006 to 2008.
Objective of the study
The study intended to:
- investigate the pattern of funding of the conventional system and the distance education system at NCE;
- analyse the cost of the two systems, i.e., the distance education system and the conventional education system of NCE;
- determine the cost effectiveness of the two systems;
- make relevant recommendations to educational planners, policy makers and institutional leaders with a view of augmenting the least expensive and more cost effective system.
Scope and limitations of the study
The research was a case study of NCE, though covering several dual-mode teacher training institutions would have been desirable. This confinement to NCE was due to limited time and resources allocated to the project which were the main constraints of this research study.
Related studies
The structural difference between distance education system and conventional education system has an economic dimension as well. Cost of education is the amount spent to acquire or impart education. Thus, cost of education can be viewed from an individual point of view or institutional/state point of view. From the individual point of view, cost of education is the amount of money spent during a particular period or stage e.g. 1 year, to acquire education; whereas, from the institutional/state point of view, cost of education is the expenditure incurred on education during a period of time. It can be noted that, in an educational enterprise, cost incurred by the supplier of education and the consumer of education can be measured separately. Thus, the cost study was undertaken from the institutional/state point of view, i.e. institutional expenditure in provision of education during the period under review. Since private cost could not be studied, the opportunity cost was also not considered in this study.
The Nkrumah College of Education (NCE) was dual-mode until 2008 when it had its distance education system discontinued by authorities that be for various reasons one of which was related to cost effectiveness. The typology of the NCE dual-mode was the Deakin Model where the D.E. students experience both on-campus and off-campus studies in the process of obtaining a diploma. The same academic staff were used to serve both the on-campus and off-campus students. However, there was a separate administrative unit to take care of off-campus students.
Effective utilization of financial resources, besides effective utilization of human resources, and effective utilization of facilities and infrastructure, is one of the indicators of cost effectiveness of a system: in this case the distance education system and conventional, campus-based education system.
Efficiency of funding mechanisms, administrative efficiency and allocative efficiency are the three important indicators of effective utilization of financial resources which were critically analysed for both the systems at NCE.
Funding of conventional education and distance education
The funding pattern of higher education varies considerably across countries and institutions. As a whole, governments provide maximum support to higher education in most countries of the world. In Denmark, Netherlands, Canada, India, and USA, the government provides funding support to the tune of 99 %, 98 %, 89 % and 78 % respectively. These World Bank data further suggest that in countries like Australia, Norway, France, Germany, Indonesia, Kenya and the U.K., government finance for higher education was 88 %, 90 %, 89.5 %, 68.5 %, 62.8 %, 62.2 %, and 55 % respectively (World Bank, 1995).
The 2007 Annual FNDP Progress Report provides a detailed account on the budget performance of the various sectors of Zambia’s economy. Under Education and Skills, of the 1,922.2 billion allocated to the sector, the sub-sector allocation is shown in Table 2.
Table 2: Summary by sub-sector (ZMK’ million)
Sub-Sector |
GRZ |
POOL |
Designated |
Total |
% of total |
ECCDE |
1,023 |
1,702 |
14,096 |
16,822 |
0.9 |
Basic education |
1,017,066 |
141,802 |
16,039 |
1,174,907 |
61.1 |
Literacy education |
300 |
0 |
- |
300 |
0.0 |
High school education |
184,945 |
111,344 |
- |
296,290 |
15.4 |
Tertiary/Higher education |
291,208 |
9,124 |
- |
300,332 |
15.6 |
Sub-sector total |
1,494,543 |
263,973 |
30,136 |
1,788,653 |
93.1 |
Administration and support |
121,601 |
11,941 |
51 |
133,594 |
6.9 |
Grand Total |
1,616,144 |
275,915 |
30,187 |
1,922,247 |
100.0 |
(Adapted from 2007 Annual FNDP Progress Report, p. 75)
Higher education comprises various entities such as colleges of teacher education, technical institutions, public and private universities, and so on. Thus, what is key in this study is how much of government funding or finances to higher education actually go to distance education systems/institutions.
The distribution of resources across programmes is shown in Table 3.
Table 3: Allocation by Programme (ZMK’ million)
Programme |
GRZ |
POOL |
Designated |
Total |
% of total |
Management and administration |
1,118,129 |
7,411 |
- |
1,125,540 |
58.6 |
Infrastructure development |
125,867 |
187,974 |
28,709 |
342,551 |
17.8 |
Equity |
31,085 |
43,413 |
1,477 |
75,976 |
4.0 |
Standards and assessment |
19,587 |
3,408 |
- |
22,996 |
1.2 |
Curriculum development and educational materials |
69,009 |
31,103 |
- |
100,113 |
5.2 |
Teacher education |
16,964 |
2,374 |
- |
19,338 |
1.0 |
Distance and open learning |
3,929 |
229 |
- |
4,159 |
0.2 |
Research and university education |
231,569 |
0 |
- |
231,569 |
12.0 |
Grand Total |
1,616,144 |
275,915 |
30,187 |
1,922,247 |
100.0 |
(Adapted from 2007 Annual FNDP Progress Report, pg. 75)
A close look at Table 3 shows that distance and open learning (DOL) is the least funded programme. It is important to note that under this programme, tertiary/higher education is not catered for. The activities for which DOL programme is funded include the following:
- Interactive Radio Instruction (IRI) for the lower grades 1–7;
- Upper basic and high school alternative education programmes (e.g. “night school”, skills training centres, etc.).
Though, governments in many countries have supported the establishment of D.E. institutions/systems in order to improve access for those who would otherwise be unable to attain educational qualifications, there is no uniformity in government funding and funding patterns.
Funding to higher education in the various countries depends so much on the economic status and political will of the particular country. However, due to transition of higher education from an elite system to a mass system during the last few decades, governments are finding it difficult to support further expansion of higher education. Governments have been further strained by this expansion. Offer of higher education to large masses has led to the proposal of cost recovery, particularly from student. This international trend which appears to favour increased “cost sharing” through student fees where students are expected to meet the full costs can restrict access for those living on low incomes and may also reduce completion rates (Rumble, 1997:89). This could be due to the fact that operation costs, particularly at the inception stage of D.E. systems could be quite high as investment is high more so for autonomous D.E. institutions. So without government support, the students would have to bear these high costs.
Zambia has the lowest budget allocation to education in the sub-region. In 2002, allocation to education was just over 2 % of GDP compared to 5 % to 6 % in the region (Manchishi, 2004:10).
It can be noted that Zambia is no exception to the fact that D.E. systems are less funded than their conventional counterpart. Thus, Zambia, a developing country with scarce resources, has D.E. programmes, courses or systems without or with very minimal (if at all any) government subsidy.
One of the requirements for comparison of effectiveness to be possible, is that the two units compared share similar ideologies and pursue similar objectives. Though this requirement might not have been met fully, there has obviously been much commonality to warrant the requirement fulfilled as the two systems of NCE shared a common mission. The mission statement thus, clearly defined the objectives of the institution, NCE.
The “No Significance Difference” results from numerous distance education comparative studies of traditional versus distance courses would suggest there are no learning differences between the two .
Funding of distance teacher education
Governments may not be the only sources of funding D.E. systems. Other than student fees, several sources could be explored to help in the funding of D.E. systems. Table 4 illustrates the different sources of funding that have accessed to support ten teacher-training projects.
Table 4: Sources of funding for teacher-training projects
Teacher-training projects |
Sources of funding |
||||
Government |
Student fees |
Community |
Private sector and NGOs |
Funding agency |
|
Brazil: Television based in-service programme |
X |
X |
X |
||
Burkina Faso: Specialist project for head teachers |
X |
||||
Chile: In-service programme on computer education |
X |
||||
China: Television Teachers Training College |
X |
X |
X |
||
India: Open University programme on guidance |
X |
X |
|||
Mongolia: Reorienting primary teachers to new approaches |
X |
X |
|||
Nigeria: National Teachers’ Institute initial training programme |
X |
X |
|||
South Africa: University degree programme |
X |
||||
South Africa: OLSET radio project for schools and teachers |
X |
X |
|||
United Kingdom: Open University post graduate certificate in education |
X |
||||
(Adapted from Perraton & Lentell 2004, p. 104)
Though many D.E. institutions obtain their funding from a variety of sources, the balance between them varies widely from institution to institution.
Cost-effectiveness
Various indicators of cost effectives are used such as average cost per course, average cost per programme, average cost per enrolled student, average cost per media and average cost per graduate. Perraton (1997) agrees with the above statement when he states that studies that examine the comparative costs of D.E. to traditional education have been done worldwide. He points out that, however, there is considerable variability in these studies as some studies looked at costs per learning hour, and some studies have explored the net costs of setting up a D.E. experience.
The most common measure of cost effectiveness is the average cost per graduate, which has been used in this study.
Wagner (1982) made an economic analysis of educational alternatives when he studied the economics of the U.K. Open University from its conception. Stated briefly, he addressed two main issues: how the costs of the Open University (OU) compared to those of the Conventional Universities (CUs) would evolve in the future and the factors that would influence their evolution.
For measures of output, Wagner used both student and graduate numbers claiming that, since OU and CU degrees are of comparable standard, this was a fair measure. He however suggested that a better measure of output would be the value-added (i.e., the difference between the academic level of a student on entry and the standard he must achieve for the degree) noting that if OU entrants are, on average, less qualified than CU entrants, use of such a measure would favour the OU in cost comparison.
While admitting that there is a difference from the consumer’s point of view, he doubted it had much relevance in a social calculus of investment costs and benefits.
Wagner showed that at the OU the annual average recurrent cost per equivalent undergraduate was less than one-third that of the CU graduate. The cost of the OU graduate was found to be less than one-half that of a CU graduate.
Similarly, Richardson (2005) in his study “Comparative Analysis in Distance Teacher Education” concluded that the distance training programme produced qualified secondary teachers at a lower cost than the conventional pre-service, campus-based programme.
Conversely, Jackson (1998) suggested that distance learning is neither less expensive nor easier than a traditional course. D.E. has a lower per student cost than traditional education but with high attrition rates, the cost per graduates in D.E. is considerably higher than that of their traditional counterparts (Rumble, 1997).
Clearly, there are differences in research findings on comparative studies of D.E. systems and Conventional systems. These differences could be attributed to various factors such as methods of cost effective analysis, cost considered, effects of student drop out, modes of delivery, and funding sources for the systems.
Method
Research design
The methodology used in this research was evaluative and descriptive. To some extent, comparative studies from other countries were done in order to come up with informed decisions on cost effectiveness elsewhere. The research examined the cost effectiveness of different educational systems in other parts of the world.
The research was a descriptive case study which required identification of a unit to be treated as a whole. In the context, the study was basically an investigation of the financial operations of the two systems of the NCE dual-mode, Conventional system and D.E. system. This was with a view to examine and critically analyse the financial operations of the two systems so as to establish which of the two systems – the Conventional system and the D.E. was more cost effective.
Why NCE as an area of focus
The Nkrumah College of Education (NCE) is the oldest and largest teacher training college offering secondary diplomas to both pre-service and in-service/serving teachers. However, there has been a lot of controversy regarding the discontinuing of the programme not only among the teaching fraternity but the community at large. The choice of this area was due to the suffering experienced by not only the local community but the teachers on secondment to basic and secondary schools that needed to upgrade their qualifications and improve their performance in their new positions. Perhaps this draws attention from the local authorities and policy makers to have an insight on the management of D.E. in the country.
This study also indirectly provides a challenge to the authorities and policy makers. It gives them a chance to help in the formulating or designing of guidelines which will be used in the running and management of D.E. systems.
Sources of data
The data was collected from both primary and secondary sources.
Primary data
This involved getting views of accounting staff and administrators of NCE who were the key informants to the study. A self-constructed questionnaire was personally administered and collected. In depth individual interviews were also conducted with the accounting staff and administrators and the responses recorded. Data thus obtained was analysed to determine the more cost effective system.
Secondary data
Another dimension of the study was to come to make documentary analysis of relevant files and literature. A variety of literature was used. The most helpful were the financial publications from the institution and the government. These publications gave an insight into the funding, funding patterns, other sources of finances and expenditures related to D.E. as a whole and the NCE D.E. system in particular.
Population and sample
This research was a case study on NCE. Thus, NCE was treated as a whole and so no sampling was carried out. The units studied were the Conventional system and the D.E. system of NCE.
The sample consisted of all the accounting staff that totalled eight (8) in number and the two (2) top administrators (principal and vice principal).
Purposive sampling technique was used to elicit the data from key informants. This not only because they were few in number, but mainly because they are the main financial officers of the institution as such were in a position to provide rightful and accurate data.
Research instruments
A self-structured questionnaire and interview schedule was used to collect data (see Appendix 1). Items comprising the questionnaire and interview schedule were written and structured to encourage correspondents to focus on the financial aspects of NCE such as: funding, funding agencies, policy on fixed assets apportionment. Open-ended questions were also included so respondents elaborated on points of interest.
Documentary analysis of NCE existing financial records – Income and Expenditure Files, Funding Files – was undertaken in order to get relevant information on the pattern of funding and various costs incurred by the two systems for the period under review.
Research procedures
Data collection took place in two ways: during semi-structured, face-to-face interviews conducted over a period of one month, and through personally administered questionnaires.
The interview process was divided into three stages: pre-interview, interview, and post-interview stage. Respondents were given a copy of the schedule prior to the interview. A time and place was agreed upon and informed consent was obtained prior to conducting the interview. The results of each interview were transcribed immediately.
Questionnaires were personally administered to the respondents after obtaining informed consent. Each correspondent was given a period of one week in which to complete filling the questionnaire. The completed questionnaires were personally collected upon completion.
Processing and analysing data
Data were analysed quantitatively and qualitatively. Responses from the questionnaires were grouped into categories according to respondents’ titles. After analysis, the responses were quantified (expressed in percentages). The data obtained through interviews and from the files were analysed based on their quality and used accordingly.
The cost-effectiveness parameters used in both systems was the unit cost per graduate. Cost per graduate was used as this is the “effective” cost of education. This cost relates to the number of persons who successfully completed a course of studies. It measured the unit cost at the end of the educational cycle for the two systems for the period under review.
The total cost incurred by the institution for the two systems were separately calculated from the various data collected and divided by the respective number of graduates for each system.
The figures thus obtained were used to calculate the cost-effectiveness ratio. A cost-effectiveness ratio of less than 1.00 was used as an indication of the D.E. system being more cost effective than the conventional system at NCE.
Findings
The study focused on capturing views and experiences of key informants in the financial operations of the institution, NCE. It also analysed financial documents pertaining to the funding, funding patterns, sources of finances and expenditures of the two systems – D.E. system and Conventional system of NCE.
Characteristics of respondents
The tables below show the years of service in current job position and job title of respondents which influenced the views concerning the financial operations of Nkrumah College of Education.
Distribution of sample by job position
Table 5: Job position of the respondents
Job Position |
Principal |
Vice Principal |
Accountant |
Accounts Assistant |
Number |
1 |
1 |
1 |
7 |
Table 5 shows that most respondents were the accounting staff – 1 accountant and 7 accounts assistants. Their views were important in assessment of the financial operations of NCE.
Years of service in current job positions of respondents
Table 6: Years of service in current job positions of respondents
Years of Service |
Principal |
Vice Principal |
Accountant |
Accounts Assistant |
1 |
1 |
|||
2 |
1 |
1 |
||
3 |
1 |
3 |
||
4 |
2 |
|||
5 |
1 |
|||
Over 5 |
Table 6 shows that most of the respondents had been in their current job positions at NCE for three years. Only three of the respondents had served for less than three years in their current job positions at NCE.
Pattern of funding at NCE
In response to the question of whether the Conventional system and the D.E. system of NCE were funded in the same way, all the respondents responded in the negative, “No”. Reasons for the difference in the funding pattern between the two systems were well summed by one of the respondents as follows:
“...D.E. system existed as a staff initiative rather than as a ministry of education programme”
Funding of the conventional system of NCE
On the question of how the Conventional system of NCE was funded all the respondents indicated government grants and student fees. A few of the respondents indicated private sector/NGOs, International Funding Agencies and sales of materials and other services. Non of the respondents showed community contributions (e.g. in kind) as one of the ways in which the Conventional system of NCE obtained funding
Documentary analysis of relevant files and literature revealed the following on the funding of the Conventional system of NCE in order of magnitude starting with the highest:
- Government grants
- Student fees
- Private sector/NGOs
- Grants from international funding agencies
- Sales of materials and other services.
The extent of the above sources of funding was determined as shown in Figure 1.
.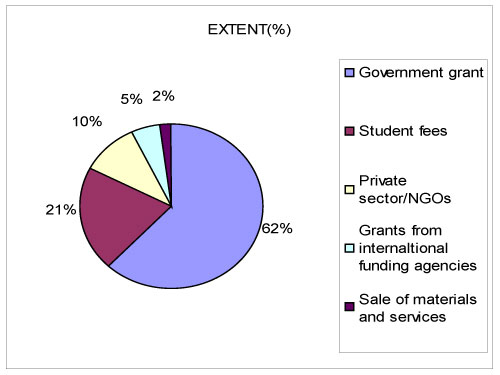
Figure 1. Source and extent of income
and funds for the NCE conventional system
(Source: Field data, 2010)
As shown in Figure 1 above, the Government is the major financier of the Conventional system of NCE. Though this funding from Government is erratic as reported by ninety eight of the respondents (98 %) it does eventual come. The institution is often given a guideline amount within which they must tailor their budgets. Thus, Government grants are not sufficient and to meet this shortfall other sources such as student fees, NGOs, grants from international funding agencies and sale of materials and services are explored. It should be noted here that the D.E. system of NCE contributes twenty percent (20 %) to the Conventional system to try and offset this shortfall.
Funding of the distance education system of NCE
On the funding of the D.E. system at NCE, all the respondents noted “student fees” as the only source of funds. No other agency was noted to fund the D.E. system at NCE. The pattern of funding for the D.E. system was different as student fees were the sole source of funds for the system, as shown in Figure 2 below.
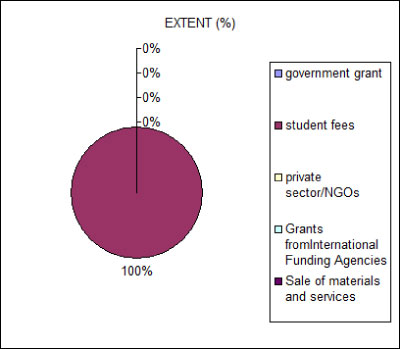
Figure 2: Sources of funds for distance education
Total cost of NCE systems
In the period under review, 2006 to 2008, the NCE-DE cohort had a student head count of a total of two thousand and ninety nine (2,099) students whilst the student head count in the Conventional system was three hundred and ninety two (392) for the Basic School Teachers’ Diploma Courses. The study revealed that the distance education students followed the same programme had the same course loads as students in the conventional education system. Thus, the fact that the D.E. programme was an exact parallel to the conventional fact-to-face one, demanding the same work load and taught by the same lecturers, it is seen as a guarantee for quality.
Students in both systems took only those subjects or courses for which they were examined. The difference however, was in the duration i.e. the duration was longer, three years (the college-based equivalent took two years). This therefore, assumes that students in both systems spent an equivalent number of hours on their studies. Therefore, inputs considered are everything that was provided to students during the course of their studies.
NCE has no study centres for provision of learner-support. The “parent” institution is solely responsible for the provision of learner-support services to its distance learners. This is an important revelation as costs related to study centres will not be part of costs incurred by the NCE D.E. system.
Performance in examinations was taken as the main indicator of the output of each system as students from both systems sat for similar and in some courses the same examinations. On successful completion, graduates from the two systems were awarded a Secondary Teachers’ Diploma by UNZA. As such, “like” will be compared with “like”.
The total cost of the systems was then derived by summing all the available costs (i.e. variable cost, semi-variable cost and fixed cost) of either system.
Operation costs of NCE
The respondents were asked to list in order of magnitude, the major operation costs in the two systems at NCE. Though similar responses were obtained, their order of magnitude differed. However, documentary analysis revealed the order of magnitude starting with the highest cost as shown below.
Table 7:
Conventional System |
Distance Education System |
Boarding |
Material Development/Production |
Teaching learning materials |
Emoluments |
Infrastructure maintenance |
Learner support |
General Administration |
Administration |
Regarding expenditure of the two systems at NCE, due to poor record keeping, it was difficult to establish actual expenditures in the various expenditure headings. As such the expenditure was identified as variable cost (operating cost/expenses) and fixed cost.
Operating expenses for both systems included commodities, travel, postage, communications, duplication of materials, assessment and contractual services. Some operation costs, such as rent, were unique to the D.E. system which had to rent premises for examination purposes as NCE could not accommodate the large number of students.
Apportionment of fixed costs
The respondents were asked to state whether NCE had a policy on apportionment of fixed cost since the two systems used the same infrastructure. The overall response was “No”.
So in order to apportion the fixed cost of infrastructure and production facilities between the two systems, the fixed costs were split in the ratio 1:3 between the D.E. system and Conventional system respectively – this was a move aimed at ensuring that the D.E. system other than funding itself, supplemented the conventional system! This was after annualization and taking the number of students into consideration in each system and approximating usage of the fixed assets by each system.
Total cost of the DE system
Thus, the total revenue was obtained by multiplying the tuition rate by the number of contact sessions for D.E. students in the three year period under study. This is because there was no scholarship scheme or student loan scheme for D.E. students and all students paid the same fees for the different subjects.
Government funded the system indirectly through the provision of infrastructure and equipment. This was attributed to the fact that the “...D.E. system existed as a staff initiative rather than as a ministry of education programme” as noted by one of the respondents. Thus, revenue for the D.E. system was solely obtained from student fees. This is line with the study by Sahoo (1985) in which he notes that for several D.E. institutions tuition fees constitute the largest source of funds. This is in consonance with what was noted by Pillai and Naidu (1999) that conventional institutions show a wide variation of sources of income whilst D.E. institutions generate all the resources from students. They also allude to the fact that some D.E. institutions generate huge amounts of resources to support the expenditure of even the parent institution, a scenario very similar to the NCE D.E. system contributed twenty per cent (20 %) of its total income to support the parent institution.
So, whereas the Conventional system of NCE received subsidies from various sources, the D.E. system solely depended on student fees.
Total cost of the conventional system
All the available variable, semi-variable and fixed costs for the period under study were summed up to arrive at the total fixed cost of the Conventional system of NCE.
Media and technology used in DE system
Though most of the D.E. systems use sophisticated media as either supplementary components of the print media or complementary components of the print media or integrated them with it, it was not so with the NCE D.E. system.
The NCE distance programme was print-based. Given the country’s infrastructure and resource levels, choice of media and technologies was limited. Print media was chosen because it is accessible, affordable, familiar and provided a permanent source that several teachers could use.
The application of technology at NCE is extremely limited. Technologies used for delivery of instruction such as radio, television, audio cassettes and video-tapes are not among the instructional materials used at NCE. So, no back-up radio or television casts were produced.
As such, infrastructure costs will not include sophisticated technological costs e.g. servers, software and, communication. However, major cost heads will include course editing and development related to print.
The cost of developing materials was minimal in that the D.E. system of NCE had been in existence since 1997, and so the cohort of students under study was for the period 2006 to 2008. As such, the materials were already developed at the initial stage of the D.E. system. Thus, no authoring costs were incurred. For this cohort, the printed materials were merely edited, reprinted and distributed to students. It was also learnt that no student materials were posted to students. Students received all their study materials at course registration time. The postage costs the D.E. system incurred was for postage of annual terminal examination results.
The printed course materials distributed to students were printed at the institution reduced the cost of printing.
Materials were printed upon student confirmation of payment of fees. So student study materials were not printed in excess and so no storage costs were incurred.
Cost per student/graduate in the conventional system and the DE system
To calculate the cost per student and cost per graduate in both systems of NCE dual-mode, all the costs incurred in provision of education to the students were considered and divided by the number of students in the particular cohort under study.
Cost per student/graduate in the Conventional system of NCE
Of the total three hundred and ninety two students (392) enrolled in the conventional system in 2006, seven (7) dropped out, ninety (90) referred (i.e. those who failed at the first attempt and retook the exam), twenty eight (28) failed and two hundred and sixty seven (267) graduated representing 1.8 % drop out, 7.1 % fail and 91.1 % graduates.
Thus, the ![]()
Cost per student/graduate in the distance education system of NCE
In the D.E. system on the other hand, two thousand and ninety nine (2099) students were enrolled in the same period, 2006. Thirty four (34) of these dropped out, five hundred and seventy three (573) referred, two hundred and one (201) failed and one thousand and eighty (1,280) graduated representing 1.6 % drop out, 27.3 % referrals, 9.6 % fail and 60.1 % graduates.
The costs in the two systems differed to some extent and is summarised in Table 8.
Table 8: Unit cost per student/Graduate of conventional system and D.E. system of NCE (2006 – 2008)
Conventional System |
D.E. System |
|
Total Fixed Cost (thousands in ZMK) |
305,482 |
416,216 |
Total Operation Cost (thousands in ZMK)Running cost i.e. not overheads |
627,478 |
3,592,874 |
Total Cost (thousands in ZMK) |
932,960 |
4,009,090 |
Student Head Count |
392 |
2099 |
Number of Graduates |
267 (68 %) |
1,280 (61 %) |
Average Cost per Student (thousands in ZMK) |
2,380 |
1,165 |
Average Cost per Graduate (thousands in ZMK) |
3,494 |
1,910 |
From Table 8 above, it can be noted that the cost per graduate/effective cost was higher than the cost per student enrolled/normal cost – this difference is due to the prevalence of dropouts.
Cost effective ratio of the DE system of NCE
To determine the cost effective system of NCE, the equation for cost effective ratio is used,
i.e. ![]()
The cost effectiveness ratio thus obtained, 0.55, can be interpreted to indicate that the D.E. system of NCE is more cost effective than the Conventional system of NCE. This is because the cost effective ratio is less than 1.00.
Though it has been established that delivering programmes through the D.E. system is cheaper that delivering the same programmes through the Conventional system of NCE, it should be noted that student fees are the sole source of funds for the operation costs of the D.E. system at NCE. This implies that students finance the running of the D.E. system at NCE through payment of fees. Unfortunately, there are no legal mechanisms in place to regulate the student fees. This is a drawback as such an approach tends to discriminate the neediest of candidates who may ultimately be the target group for the D.E. system.
Discussion
This chapter presents interpretations of the study. The discussion is based on the objectives of the study which were to investigate the pattern of funding, analysis the costs of producing effective basic school teachers using the two systems, the Conventional system and the Distance Education system, of Nkrumah College of Education and make a comparative analysis in order to determine the more cost effective system.
Characteristics of the respondents
The research presented biographical data which helped in the categorization of respondents in terms of job positions and years of service in respective job positions. Data indicates that there more accounting staff than administrators. It also indicates that seventy percent of the respondents have been in their current job positions for at least three years. The longest in the current job has been in the position for five years.
Pattern of funding of Nkrumah College of Education
The pattern of funding was one of the objectives of the study. This was to ascertain and measure the extent to which government financed the two systems – Conventional system and Distance Education System – of Nkrumah College of Education. The first step was to find out if the government did finance the two systems.
Pattern of funding of the conventional system
This was indicated by noting the sources of finances in the Conventional system. Government grants were noted as of the major source of funding of the Conventional system. Other than the government, student fees, private sectors/NGOs, International Funding Agencies, and sale of materials and services were the other sources of funding. Government accounted for sixty two percent of the total funding of the Conventional system.
Pattern of funding of the distance education system
It also found that government did not fund the Distance Education system. The D.E. system was solely financed by fees which students paid.
Appropriateness of current pattern of funding NCE
The respondents were asked to state whether the current pattern of funding the two systems was appropriate. The response to this was “No”. A review of the reasons for the “No” response given for the inappropriateness of the current funding pattern of the two systems at NCE, revealed various reasons which include the following:
- student fees are to high for most of the learners to afford
- both systems should have some government funding to cushion the operation costs
- reliance on student fees to meet all operation costs over burdens the students
- differences in funding patterns could compromise on quality.
Cost effectiveness ratio of Nkrumah College of Education
The research established that the unit cost per graduate of the D.E. system was lower than that of the Conventional system of NCE. The Cost Effectiveness Ratio obtained was 0.55.
Conclusion
Cost per graduate, i.e. the cost per successful candidate/learner is termed as the effective cost. Ideally, this cost per learner enrolled and the cost per successful student should be the same. However, this was not the case due to the prevalence of dropouts. Therefore, cost per graduate is higher than cost per enrolled student.
This study has shown that the cost per graduate of the Distance Education system is lower than the cost per graduate of the Conventional system of Nkrumah College of Education. Thus, the system with a lower unit cost per graduate was assumed to be the more effective system. This is because cost per graduate encompassed efficiency of funding mechanisms, administrative efficiency and allocative efficiency all of which are important indicators of effective utilization of financial resources.
The study further gives a cost effectiveness ratio of 0.55. This situation leads to the conclusion that the D.E. system of NCE is more cost effective than the Conventional system. The study has further shown that the despite lack of government funding, the D.E. system is still more cost effective than the Conventional system.
The study has also revealed that student fees have both a negative and positive effect. Though student’s fees can finance the running of a D.E. teacher training programme, it increases the dropout rate as most students drop out due to failure to settle their fees.
The study also underscored the need for government to fund educational programmes particularly the D.E. programmes in order to make them affordable for the neediest for whom it is much intended.
Laidlaw and Layard (1974) in their paper similarly concluded that the D.E. system was cost effective relative to the Conventional Universities in Britain. This is in consonance with Perry (1976:31) when he concludes that,
“…however one tries to make a comparison of the cost of educating students in a conventional university and whatever basis one uses for making this comparison, one is forced to the conclusion that education through open universities is relatively very cheap.”
The study has therefore, shown that delivering programmes through the D.E. system is cheaper than delivering the same programmes through the Conventional system at NCE.
Though it has been established that delivering programmes through the D.E. is cheaper than delivering the same programmes through the Conventional system in NCE, it should be noted that student fees are the sole source of funds for the operation costs of the D.E. system through payment of fees. Unfortunately, there are no legal mechanisms in place to regulate the student fees. This is a drawback as such an approach tends to discriminate the neediest of candidates who may ultimately be the target group for the D.E. system.
Recommendations
This sub section provides recommendations and suggestions on how the Distance Education systems can be managed and to ensure their long term viability. The study identified challenges in the management of distance education which should be addressed through the following recommendations:
- The data of all costs should be kept in form that it is easily retrievable and interpreted to ensure accurate cost calculations.
- Efforts must be made by the Directorate of Distance Education, Ministry of Education, Zambia to formulate guidelines on the management and running of D.E. systems in order to augment it.
- The mechanism to regulate student fees should be put in place in order to make distance learning affordable to the neediest for whom it is much intended.
- The Government should include D.E. systems/institutions in their funding policy particularly in the initial or inception stage of their operation.
References
- Coombs, P. and Jacques, H. (1977). Cost Analysis in Education: a tool for policy and planning. Baltimore: John Hopkins University Press.
- Haambokoma, C. and Chabalenga, V. (2003). Feasibility of Providing Training in Teaching Through Distance Mode to Untrained Graduate Teachers of Mathematics and Science. In Putsoa Bongile, et al. (Eds.) Southern African Association for Research in Mathematics, Science and Technology Education. Pretoria: University of Pretoria Press.
- Hui, H.W. (1989). Learner Support Services (ES-313, Block 1, Unit 4). New Delhi: Indira Gandhi National Open University.
- Hulsmann, T. (Ed.) (2004). Costing Open and Distance Learning. Vancouver: COL.
- IGNOU. (2009). Distance Education: Economic Perspective (ES-317, Block 3 & 4, Unit 4). New Delhi: Indira Gandhi National Open University.
- Laidlaw, B. and Laynard, R.(1974). Traditional Versus Open University Technology Methods: A Cost Comparison. Higher Education.
- Ludwig-Hardman, S. and Dunlap, J.C. (2003). Learner support services for online students: scaffolding for success. International Review of Research in Open and Distance Learning, 4(1).
- Mace, J. (1978). Mythology in the making: is the Open University really cost effective? Higher Education, 7.
- Manchishi, P.C. (2004). The Growth of Teacher Education in Zambia since Independence. Paper presented at the workshop to mark 40 years of Zambian History, 22 – 23 October, 2004.
- Melody, K.W.H. (1986). New Communication Technologies – rooms to negotiate. Media Development, 33(2).
- Ministry of Education (1996). Educating Our Future; National Policy on Education. Lusaka: Zambia Educational Publishing House.
- Ministry of Finance (2008). 2007 Annual Fifth National Development Plan Progress Report. Lusaka: Government Printers.
- Muunga, A.M. et al. (2000). Commonwealth Education Fund, Zambia: End of Project Evaluation Report.
- NCE (2007). Research and Publications Committee. Kabwe: NKRUJORE, No.5.
- Office of the Vice-President (1969). Zambian Manpower. Lusaka: Zambia Educational Publishing House.
- Perry, W. (1976). Open University. Milton Keynes: Open University Press.
- Peterson, R. (1986). The anatomy of cost-effectiveness analysis. Evaluation Review, 10(1).
- Pillai, C.R. and Naidu, C.G. (1999). Cost Effectiveness of Distance Higher Education. New Delhi: Indira Gandhi National Open University.
- Robinson, B. (1995). Research and Pragmatism in Learner Support. In F. Lockwood (Ed.), Open and Distance Learning Today. London: Routledge.
- Romiszowski, A.J. (1996). Handbook of research in educational communication and Technology. New York: Simon & Schuster.
- Rumble, G. (1997). The Costs and Economics of Open and Distance Learning. London: Kogan Page.
- Sewart, D. et al. (1983). Distance Education: International Perspectives. Beckanham: Croom Helm.
- Thrope, M. (1988). Open Learning, Module 2 of the Post-Compulsory Diploma in Education. Milton Keynes: The Open University.
- Tsang, M. (1988). Cost analysis of the cost-effectiveness of CAI and factors associated with its successful implementation in higher education. AEDS Journal, 15(1).
- Wagner, L. (1982). The Economics of Educational Media. London: MacMillan.
- Wright, S.J. (1991). Research on selected aspects of learner support in distance education programming: a review. Selected papers part 1, The Second American Symposium on Research Distance Education, Pennsylvania State University.
- Zemsky, R. (2004). Why the e-learning boom went bust. The Chronicle of Higher Education, 50, B6.
Appendix-1: Research Questionnaire for Accounting Staff and Administrators of Nkrumah College of Education
Instructions:
- Do NOT write your name on this questionnaire
- Place a tick or write in the appropriate spaces provided
- PLEASE, answer ALL the questions as freely and as honestly as possible
- All answers will be treated CONFIDENTIALLY
1. Sex Male [ ] Female [ ]
2. Job title: ………………………………………………………………...
3. Years of service in current job position: ……………………………….
4. Are the conventional system and the distance education system of Nkrumah College of Education (NCE) funded in the same way?
Yes [ ] No [ ]
If the answer to this question is ‘Yes’, proceed to question 6.
5. Why is there a difference in the funding of the two systems – conventional system and distance education system – at NCE?
………………………………………………………………………………
………………………………………………………………………………
6. How is the conventional system of NCE funded?
- Government grant [ ]
- Student fees(or other charges) [ ]
- Private sector/NGOs [ ]
- Grants from International Funding Agencies [ ]
- Community contribution (e.g. in kind) [ ]
- Sales of materials and other services [ ]
Any other funding agency? Specify ………………………………….
7. How is the distance education system of NCE funded?
- Government grant [ ]
- Student fees(or other charges) [ ]
- Private sector/NGOs [ ]
- Grants from International Funding Agencies [ ]
- Community contribution (e.g. in kind) [ ]
- Sales of materials and other services [ ]
Any other funding agency? Specify …………………………………
8.a) Where does the conventional system of NCE get MOST of its funding?
…………………………………………………………………………….
8.b) Where does the distance education system of NCE get MOST of its funding?
…………………………………………………………………………….
9.a) Does the college – NCE- have a policy on fixed cost apportionment for its capital assets such as buildings and production facilities?
Yes [ ] No [ ]
9.b) If ‘Yes’, what is the NCE policy on fixed cost apportionment in relation to the two systems – conventional system and the distance education system?
……………………………………………………………………………
10. In your own view, is the current pattern of funding the conventional system and the distance education system at NCE appropriate?
Yes [ ] No [ ]
Give reason(s) for your answer above.
………………………………………………………………………………
11. List, in order of magnitude, the major costs of operation (operating costs) in the two systems at NCE, starting with the highest cost.
Conventional System |
Distance Education System |
12. Which of the two systems – conventional system and distance education system – would you say is more cost effective?
………………………………………………………………………………
Give reason(s) for your answer above
………………………………………………………………………………
………………………………………………………………………………
Appendix-2: interview schedule for accounting officers and administrators of Nkrumah College of Education (NCE)
- How are the two systems of NCE – conventional system and distance education system - funded?
- Why are the two systems funded differently? (If differently funded)
- In what form is this funding?
- Is the funding sufficient for effective running of the systems? If not, how is the shortfall offset?
- What are the advantages of the current system of funding the two systems at NCE?
- What problems arise from the current approach of funding the two systems?
- What legal mechanisms are in place to regulate the student fees levels?
- What legal provisions empower the distance education system to collect student fees?
- Is there a policy guiding the managing of distance education systems?
- What principle(s) can you suggest for inclusion in a national or institutional policy on student fees?
- Which of the two systems – conventional system and distance education system – would you say is the more cost effective? Why?