

![]()
Influence of Learning Styles on Graphical User Interface Preferences for e-Learners
Velimir Dedić [velimir.dedic@gmail.com]
Modern Business School Belgrade, Serbia
Suzana Marković [msuzana@gmail.com] Business School of Professional Studies
Blace, Serbia
Abstract
Implementing Web-based educational environment requires not only developing appropriate architectures, but also incorporating human factors considerations. User interface becomes the major channel to convey information in e-learning context: a well-designed and friendly enough interface is thus the key element in helping users to get the best results quickly. Interface settings will affect the quality of students learning that accommodates their needs in terms of personalizing the content, structure, and presentation.
This paper investigates the importance of a certain choice offered: if several graphical user interface designs are offered to distance learning students of known learning styles, should we find any preferences? We have found that learner’s preference towards a specific GUI is not correlated to any particular learning style. We, did however, find that a fact of having any preference towards a GUI is associated with AC score of Kolb’s model.
Keywords: learning style, graphical user interface, e-learning, LSI
List of topics
Introduction
There are a number of implicit and explicit frameworks designed to investigate e-learning practice. Founded on theoretical frameworks, they identify the factors that need to be considered in pursuit of the creation of good quality e-learning experiences. Several of these frameworks suggest key components that influence the quality of the e-learning experience: technology, pedagogy, organizational context and creativity [9], [15]
It is not yet clear how learners perceive e-learning environments, and in what ways they assist or hinder learners in their learning. In [4], [13] and [24] authors reports that much e-learning fails to live up to learner’s expectations. It is recommended to focus attention on investigating students’ experience of e-learning [10]. However, when designing an e-learning course [26] instructors are faced with many considerations and decisions that consequently affect how students experience instruction, construct and process knowledge. Important decisions related to the didactic design of a course may refer to one of five fields of instruction [2], [26]:
- Course design, learning material, and electronic course environment: The quality of the learning environment and the easiness of using a learning management system also contribute to the success and course satisfaction of an e-learning course and performance.
- Interaction between students and an instructor: interaction supports knowledge construction, motivation, and the establishment of a social relationship. The exchange of information regarding educational content as well as socio-emotional information is important for learning.
- Interaction with peer students: this aspect consists of communication processes, where students exchange information of the course contents and socio-emotional information.
- Individual learning processes: e-learning students may receive ample opportunities to practice and apply what they are learning.
- Course outcomes: course outcomes may refer to cognitive, such as theoretical and methodical knowledge, skills required for problem solving, personal/social competences and emotional variables, satisfaction with a course.
Some of the most powerful concepts in user interface design come about by applying specific decision-making strategies that can be grouped into the following overall elements [12]: assisting user retention (promoting “learnability”); putting the user in control; creating logical and consistent screen design; and providing efficient user guidance. To consistently create highly effective GUI designs on time and on budget, designers must also carefully evaluate every interface design element with consideration of specific instructional contexts, technical specifications and user preferences, so we believe that graphical user interface features may pose significant role in the context of overall perception of e-learning experience. In [20] it is suggested that four elements should be considered when developing e-learning environments: environmental characteristics, environmental satisfaction, learning activities, and learners’ characteristics. Environmental characteristics, such as synchronous or asynchronous interaction, will create an environment that allows learners to share information. Furthermore, it determines how to retrieve useful information. Environmental satisfaction will enhance learners’ perceptions of technology that might promote their participation in the learning processes. Learning activities in e-learning provide sharing knowledge and experience among learners and instructors. In essence, when users feel less self-confident toward information technology, they also show less positive feelings toward the technology [20]. Using the structural equation modelling software (PLS Graph), researchers [6] found that course structure, instructor feedback, self-motivation, learning styles, interaction, and instructor facilitation significantly affect student satisfaction, but only two variables, instructor feedback and student learning styles, significantly affect the perceived learning outcomes of e-learning students.
According to the influence of a learning style to graphical user interface design, there are two basic research flows:
- investigation if presentation of learning content and learning tools design based upon learning styles is a factor which impacts academic achievements of the learner;
- investigation if learning styles can be meaningfully used in design of the online learning environments for personalized online learning.
It may be interesting to explore how a certain learning style detected for a particular learner affects his or her GUI preference. In addition, the user interface becomes the major channel to convey information [22]; a well-designed and friendly enough interface is thus the key element in helping users to get the best results quickly. Interface settings will affect the quality of students learning that accommodates their needs in terms of personalizing the content, structure, and presentation. This research presents methodology and results on our research aiming to determine correlation between learning styles determined and learners’ preferences to a particular graphical user interface. Learning styles for students participating in the study were determined by applying standard questionnaire (Learning Styles Inventory) for determining learning styles according to Kolb.
Not many research reports were available at the time of our work. We are concentrating our discussion on journal articles reporting results on experiments designed to determine some of features on relationships between GUI preferences and learning styles.
Learning Styles
Learning style is a distinctive and habitual manner of acquiring knowledge, skills or attitudes through study or experience, while learning preference is favouring of one particular mode of teaching over another [27]. Learning styles are also considered a valid predictor of success in a Web-based learning environment [8]. There are many classification schemes of learning styles. Almost every learning style model has its own assessment tool in a form of a questionnaire. These learning style inventories include various amounts of questions about personality, study attitude and behaviour [16]. Learning style inventories help people to be more aware of their learning style but it has to take into account that they have also limitations.
In [5], the list of 71 different learning styles was compiled, while 60 of the styles have their own measurement tool, having divided learning styles in five groups:
- Genetic and other constitutionally based learning styles and preferences (examples include Visual-Auditory-Kinesthetic – VAK and Visual-Auditory-Kinesthetic-Tactile – VAKT models)
- Cognitive structure based learning styles (example of is Cognitive Style Analysis)
- Stable personality type based learning styles (examples include Myers-Briggs Type Indicator and Jackson’s Learning Styles Profiler)
- Flexibly stable learning preferences (examples include Kolb’s Learning Styles, Honey and Mumford's learning style model and Felder-Silverman model)
- Learning approaches and strategies (examples include Entwistle’s Approaches and Study Skills Inventory for Students and Sternberg’s theory of thinking styles)
Kolb’s Learning Styles
The Kolb Learning Style Inventory (LSI) is a commercially available questionnaire (www.learningfromexperience.com) with twelve items where respondent’s rank-order four sentence endings that correspond to the four separate learning styles: diverger, converger, assimilator, and accommodator. These four styles of learning are assessed by first determining two dimensions (abstract/concrete, also known as perception continuum and active/reflective, also known as processing continuum), which describe four abilities required to be an effective learner. Classification of learners is attained by calculating four scores (two per dimensions) abstract conceptualization (AC score) and concrete experience (CE score) for abstract/concrete dimension and active experimentation (AE score) and reflexive observation (RO score) for active/reflexive dimension.
Scores on the Kolb’s Learning Style Inventory identify the learner’s preferred style of receiving and organizing information while learning [8]. A number of scholars have applied Kolb’s learning style theory to study the effects of e-learning and hypermedia learning, and some indicate that learning styles are a key factor in the effectiveness of learning [18]. In [3] it was found that convergers show a stronger preference for computer-based delivery and assimilators show a stronger preference for print-based delivery. Authors in [28] discovered that learning style-based performance differences when using analogical vs. abstract models to learn a text-based electronic mail system: convergers and assimilators performed better with the abstract model; accommodators and divergers performed better with the analogical model. When learning relational database Structured Query Language [14] it was demonstrated that abstract learners form more accurate and complete mental models than concrete learners.
Research Methods
The main research question of this study was: is there a correlation between detected learning style of a student and his or hers preference towards a specific graphical user interface used in web-based learning environment? Students participating in the study were enrolled at one-year program of professional education (software development for Internet), in web-based distance learning fashion. Learning management system used was in-house-built web application (named DLS). Total of 210 students were invited to participate in the study, what required physical presence of subjects. Total of 51 students took participation in the study and all of them have returned answer sheets with properly indicated choice. Our sample consisted of active IT professionals, with less than one year of web programming experience, but with four or more years of experience in the IT industry sector.
Learning styles for students participating in the study was determined by applying questionnaire (Learning Styles Inventory, LSI) for determining AC, CE, RO, and AE scores and subsequent classification of learners to one of four learning styles (diverger, converger, assimilator, and accommodator) according to Kolb. Results by participant gender are presented in Table 2 and total results are shown by Figure 2.
The total sample of 51 distance learning student was subjected to the procedure devised to determine correlation between learning styles and GUI preferences. The procedure was explained to the subjects. The procedure was the following: each subject was placed in front of 17” computer screen, which initially was displaying black full screen. After five minutes adjustment period subjects were instructed to hit any key on their keyboards and 12 different GUIs were displayed for 15 seconds each, with five seconds black full screen between every two consecutive GUIs. Every GUI was numbered, with large number between 1 and 12 displayed in the upper right corner of the screen. Number was coloured in a distinctive light green, very different from colours used in GUIs. Table 1 shows GUI display sequence. The complete circle of displaying all 12 GUIs was repeated for three times.
There were three dominant colours of interface, two interface widths and two sidebar positions, which gave total of 12 combinations of GUI. GUI colours were reduced to the three particular values due to limitations imposed by corporate colour scheme that have reduced full colour spectrum to red, blue and grey for designing interface.
Interface width is defined as ratio of total browser width and active application width. Two different interface widths were used: normal width and full screen width. Normal width employed total browser width to active application width ratio of 0.7, while full screen width had total browser width to active application width ratio of 1.
Sidebars were basically placeholders for DLS controls (calendar, content browsing, and multimedia download). Two different sidebar positions were examined: one with a single sidebar placed left, and another one with two sidebars (left and right). Right-sided sidebar only was not used.
GUI sequence code |
Colour |
Sidebars |
Width |
1 |
Red |
One |
Normal |
2 |
Red |
One |
Wide |
3 |
Red |
Two |
Normal |
4 |
Red |
Two |
Wide |
5 |
Blue |
One |
Normal |
6 |
Blue |
One |
Wide |
7 |
Blue |
Two |
Normal |
8 |
Blue |
Two |
Wide |
9 |
Grey |
One |
Normal |
10 |
Grey |
One |
Wide |
11 |
Grey |
Two |
Normal |
12 |
Grey |
Two |
Wide |
Subjects, provided with simple answer sheet, with instruction: “Please encircle number that matches GUI you would like to have as a new interface in your DLS?“, and having a list of numbers (1-12), were asked only to encircle a GUI number that matched a GUI they found to be the most suitable for them. Respondents were also having the opportunity to encircle number 13 which indicated „no preference“.
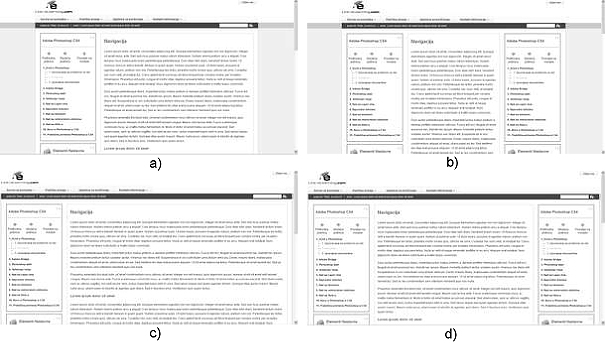
Figure 1. GUI template – a) normal width, one sidebar; b) normal width, two sidebars; c) full screen width, one sidebar; d) full screen width, two sidebars
Results
The average age of 51 participants in this study was 31.8±0.2 years, all having high school diploma at least, with 36 (68.9 %) male respondents, and 15 (31.1 %) female ones. There was 22 (43.1 %) assimilators, 15 (29.4 %) borderline or undefined, 9 (17.6 %) divergers, 3 (5.9 %) convergers and 2 (3.9 %) accommodators. Distribution of GUI preferences is shown in Table 3. Chi-square test was used to determine if there was any differences in learning styles with respect to gender, but no significant difference was found (p=0.602, with 4 degrees of freedom). Table 3 presents GUI preferences as determined by previously explained procedure (np indicates „no preference“) by gender. Chi-square test do not indicate any significant differences in GUI preference distribution (p=0.188, 11 degrees of freedom).
Table 2: Learning styles by gender (F-female, M-male)
Learning style |
Gender |
Total |
|
F |
M |
||
Converger |
0 |
3 |
3 |
Diverger |
4 |
5 |
9 |
Accommodator |
1 |
1 |
2 |
Assimilator |
6 |
16 |
22 |
Borderline or undefined |
4 |
11 |
15 |
Total |
15 |
36 |
51 |
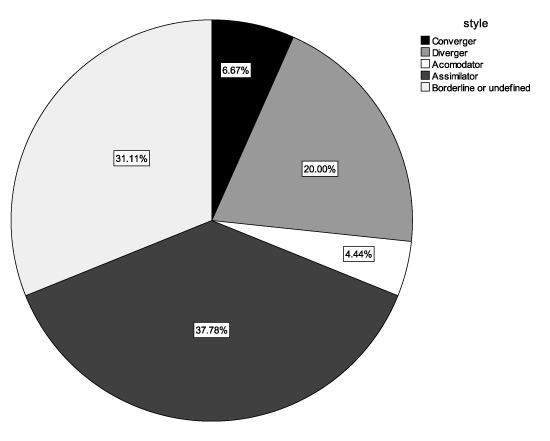
Figure 2. Proportions of learning styles determined
Table 3: Distribution of GUI preferences by gender (F-female, M-male)
Interface |
Gender |
Total |
|
F |
M |
||
1 |
2 |
3 |
5 |
2 |
4 |
4 |
8 |
3 |
1 |
0 |
1 |
4 |
2 |
2 |
4 |
5 |
1 |
6 |
7 |
6 |
1 |
6 |
7 |
7 |
0 |
1 |
1 |
8 |
0 |
6 |
6 |
9 |
1 |
0 |
1 |
10 |
1 |
3 |
4 |
12 |
1 |
0 |
1 |
No preference |
1 |
5 |
6 |
Total |
15 |
36 |
51 |
Table 4 presents gender distribution of interface colour choices. Chi-square test supports the conclusion that interface colour distribution was not random (p=0.025, with 3 degrees of freedom). It is the blue interface colour that is predominantly chosen by male students to account for the significant difference in colour distribution and Table 5 shows interface width choices by gender of students. Chi-square test did not show statistically significant difference in the distribution (p=0.746, with 2 degrees of freedom). Table 6 shows sidebars width choices by gender of students. Chi-square test did not show statistically significant difference in the distribution (p=0.766, with 2 degrees of freedom).
Table 4: Interface colour choice by gender (F-female, M-male)
Colour |
Gender |
Total |
|
F |
M |
||
Undefined |
1 |
5 |
6 |
Red |
9 |
9 |
18 |
Blue |
2 |
19 |
21 |
Grey |
3 |
3 |
6 |
Total |
15 |
36 |
51 |
Table 5: Interface width choice by gender (F-female, M-male)
Width |
Gender |
Total |
|
F |
M |
||
Undefined |
1 |
5 |
6 |
Normal |
5 |
10 |
15 |
Wide |
9 |
21 |
30 |
Total |
15 |
36 |
51 |
Table 6: Sidebars choice by gender (F-female, M-male)
Sidebars |
Gender |
Total |
|
F |
M |
||
Undefined |
1 |
5 |
6 |
2 |
4 |
9 |
13 |
1 |
10 |
22 |
32 |
Total |
15 |
36 |
51 |
Table 7 summarizes relationship between learning styles detected and interface preferences for the students. Chi-square test did not find any significant differences in distribution of learning styles detected in respect to interface styles chosen (p=0.359, with 44 degrees of freedom).
Table 7: Interface preference and learning style detected
Learning style |
Interface |
Total |
|||||||||||
1 |
2 |
3 |
4 |
5 |
6 |
7 |
8 |
9 |
10 |
12 |
No pref. |
||
Converger |
0 |
0 |
0 |
0 |
0 |
2 |
0 |
1 |
0 |
0 |
0 |
0 |
3 |
Diverger |
3 |
1 |
0 |
1 |
0 |
1 |
0 |
1 |
0 |
1 |
1 |
0 |
9 |
Accommodator |
0 |
1 |
0 |
0 |
1 |
0 |
0 |
0 |
0 |
0 |
0 |
0 |
2 |
Assimilator |
0 |
5 |
0 |
0 |
3 |
3 |
0 |
2 |
1 |
3 |
0 |
5 |
22 |
Borderline or undefined |
2 |
1 |
1 |
3 |
3 |
1 |
1 |
2 |
0 |
0 |
0 |
1 |
15 |
Total |
5 |
8 |
1 |
4 |
7 |
7 |
1 |
6 |
1 |
4 |
1 |
6 |
51 |
Based on the analysis, there are two figures of learning styles proportions in respect to interface preference and GUI preference proportions in respect to learning styles of students, respectively:
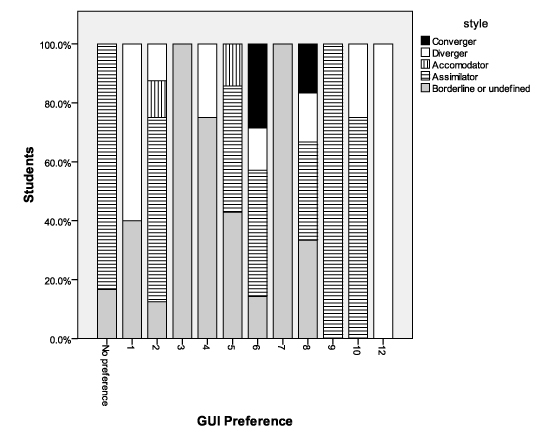
Figure 3. Learning styles proportions in respect to interface preference
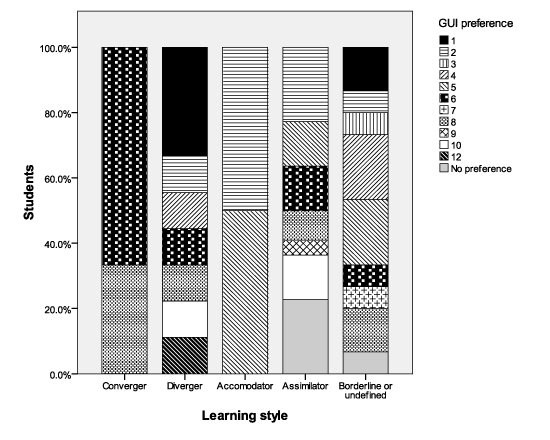
Figure 4. GUI preference proportions in respect to learning styles of students
Table 8 presents matching between GUI preference expressed and having expression of learning styles. Term having expression means not being in group “borderline or undefined” for learning style, and not being in group “no preference” for graphical user interface. Fisher's exact test did not find any significant differences in distribution of students (p=0.422) and Table 9 presents matching between GUI preference expressed in respect to students gender. Fisher's exact test did not find any significant differences in distribution of students (p=0.422).
Table 8: Learning style expressed and GUI preference expressed
GUI preference expressed |
Learning style expressed |
Total |
|
No |
Yes |
||
No |
1 |
5 |
6 |
Yes |
14 |
31 |
45 |
Total |
15 |
36 |
51 |
Table 9: Gender and GUI preference
Gender |
GUI preference expressed |
Total |
|
No |
Yes |
||
F |
1 |
14 |
15 |
M |
5 |
31 |
36 |
Total |
6 |
45 |
51 |
Table 10 presents matching between learning styles expressed in respect to students gender. Fisher's exact test did not find any significant differences in distribution of students (p=0.532) and Table 11 presents matching between learning styles expressed in respect to GUI preference expressed. Chi-square test did not find any significant differences in distribution of students (p=0.311 with 4 degrees of freedom).
Table 10: Learning style expression and gender
Gender |
Learning style expressed |
Total |
|
No |
Yes |
||
F |
4 |
11 |
15 |
M |
11 |
25 |
36 |
Total |
15 |
36 |
51 |
Table 11: Learning style and GUI preference
Learning style |
GUI preference expressed |
Total |
|
No |
Yes |
||
Converger |
0 |
3 |
3 |
Diverger |
0 |
9 |
9 |
Accommodator |
0 |
2 |
2 |
Assimilator |
5 |
17 |
22 |
Borderline or undefined |
1 |
4 |
15 |
Total |
6 |
45 |
51 |
Learning style expression and GUI preferences are given in Table 12. Chi-square test did not find any significant differences in distribution of students (p=0.171 with 11 degrees of freedom).
Table 12: Interface choice and learning style expressed
Interface |
Learning style expressed |
Total |
|
No |
Yes |
||
1 |
2 |
3 |
5 |
2 |
1 |
7 |
8 |
3 |
1 |
0 |
1 |
4 |
3 |
1 |
4 |
5 |
3 |
4 |
7 |
6 |
1 |
6 |
7 |
7 |
1 |
0 |
1 |
8 |
2 |
4 |
6 |
9 |
0 |
1 |
1 |
10 |
0 |
4 |
4 |
12 |
0 |
1 |
1 |
No preference |
1 |
5 |
6 |
Total |
15 |
36 |
51 |
Binary logistic test was applied in order to determine correlation between learning style scores (AC, CE, AE, RO) and having preference towards interface, controlled for students gender. General binary logistic model applied to our case is:
![]()
Equation 1
Equation 1 states that probability (p) of expressing a preference towards GUI for a certain student is function of his or hers Kolb’s scores (AC, CE, RO and AE).
Then, by applying binary logistic regression procedure in SPSS software package, we find that, besides constant coefficient, only AC score exhibits statistically significant contribution towards probability of having a preference to GUI (p=0.001 for the constant b0, p=0.048 for AC, p>0.05 for CE, RO and AE). Therefore, we can write:
![]()
Equation 2
And from the output of SPSS analysis:
![]()
Equation 3
Finally, by substituting (2) and (3) to (1), the binary logistic regression model is
![]()
Equation 4
Results are indicating that AC score influences the strength of preference towards GUI choice. It is found (odds ratio for AC score, OR=1.19) that for every unit increase of AC score, it is 19 % more likely that a student will express preference towards GUI.
Conclusion
We have investigated correlations between individual preference towards a certain graphical user interface choice and student’s learning style. The most of students (43.1 %) were of assimilator learning style, while the rarest learning style was accommodator (3.9 %). Graphical user interface used in the experiment exhibited three features: dominant colour, interface width and number of sidebars. First, we have investigated distribution of students’ choices of interfaces, colours, interface widths and sidebars with respect to gender. Only gender-sensitive preference to interface colour was detected (male students preferred blue interface), but no correlation between learning styles, determined by using Kolb’s Learning Styles Inventory, and graphical user interfaces chosen, was detected. Finally, we have investigated correlations between learning styles expression and graphical user interface expression, splitting the group of students by the following two criteria: students having expressed learning style (AC, RO, CE, AE) or not (borderline or undefined) and having preference towards graphical user interface (interfaces 1-12) or not (no preference). Still, no correlation was found, neither was any gender sensitivity for having expressed preference towards a graphical user interface or having expressed learning style. However, we did find interesting fact: AC score of Kolb’s Learning Styles Inventory questionnaire did correlate with student’s expressed preference towards graphical user interface. This makes the most important finding of our work: students with high AC score are more sensitive towards graphical user interface choice. Personalization of graphical user interface in web-based learning environments should be designed and executed having this finding in mind.
In [22] authors argue that different cognitive styles are correlated to content organization, search result presentation and navigation structure of a web directory. Whilst web directory was not the environment of our research, and different instruments were used to classify individual learners, it is concluded that with respect to GUI-learning styles correlation, studies are not directly comparable, but we believe that it makes sense to compare some of results. The study [22] employed Cognitive Styles Analysis for learners’ classification, and presented four different types of interface design. Cognitive Styles Analysis recognizes field-dependent (FD) and field independent (FI) learners, where it is reported that field-dependent learners are more influenced by external structure and format of the content presented within a web-interface. Field-independent learners are however less influenced in aforementioned context. Authors are reporting that differences between field-dependent and field-independent learners are supporting what was previously found in literature (FI learners are more focused on procedural details of information presentation, more active in information search, having preferences towards alphabetical ordering of content, needing less guidance in restructuring personal learning space, while FD learners are more focused on global view on information space, like relevance-based ordering of presented information and need more guidance in restructuring personal learning space as they are prone to information seek delays due to information overload). As we have found that AC score solely contributes to decision whether a learner has preference towards a certain GUI, it would be meaningful to further investigate correlation between active conceptualization score and field dependence/independence. It may be that only for those individuals with high AC score testing for field dependence/independence might provide meaningful detailed adaptation of GUI.
In [21] it was reported that learners with different learning styles (Kolb’s Learning Styles Inventory was used) exhibit different navigational needs. Research was focused on the processing continuum of Kolb’s model, contrasting RO and AE scores. It was found that explorers (learners with high AE score) are more prone to jumping around learning modules, while observers (learners with high RO score) were more likely to follow the predefined path. This finding, not investigating GUI features but navigational preferences, can be compared with our results in the broader context. From [21] we can conclude that assimilators and divergers, learners having high RO scores are more likely to follow predefined learning path, while accommodators and convergers are more likely to express non-linear behaviour when browsing learning content. Having our research taken into account, it is our conjecture that only assimilators and convergers might need special attention to particular features of GUI.
In [17] authors have conducted research based on Kolb Learning Inventory learning styles classification. They have found that most of students that have reported that look and feel of the GUI was important were of diverging learning style. It is reported in this study that both demographic and academic background of students and learning style determined contributed to GUI preferences. This finding contradicts with our results. However, authors are reporting of learners clustered over “simplicity of interface, balanced colours of interface and interface friendliness”, but relevance of learning style association with interface features is inconclusive.
In [23] correlations between frequency of problem solving strategies used by learners and Kolb’s test scores were reported. Problem solving strategies included following five modes: brainstorming (technique for generating new ideas during the problem-solving process in a non-evaluative setting), combining (the problem elements in new, different ways is another strategy of creative problem solving), analogy (the most common used mechanism for solving problems by discovering their deep structure principles), visualization (involves restructuring the problem in new ways, so that new insights would emerge), and step-by-step analysis (a mechanism of decomposing the problem into its elements and selecting operators or actions to eliminate the difference between the initial and the goal state) as defined in [1]. Correlation coefficient between AC score and frequency of visualization strategy usage estimation was positive and statistically significant (p<0.05). There were no statistically significant correlation coefficients between AC score and four other problem solving strategies found. Moreover, correlation coefficient between AC score and frequency of visualization strategy usage estimation was one of only two statistically significant positive correlation coefficient in the analysis (statistical significance was reported for AE score: negative correlation coefficients for analogy, step-by-step analysis, visualization; and for RO score: positively correlated with combining strategy). This result might explain why learners scoring high in AC are more likely to ask for more control over their user interface – this might be due to their tendency for using visualization as a problem solving strategy. This can be substantiated even directly: restructuring as a feature of visualization problem solving approach is exactly what is expected when adapting the GUI.
It is reported in [25] that convergers and assimilators exhibit better visualization skills measured by Isham’s visualization skills test. Since visualization is understood as a vital component in problem-solving strategy [17] and knowing that only convergers and assimilators can have high AC score, the fact reported by authors in [25] is indirectly confirming our findings.
We have found that learner’s preference towards a specific GUI is not correlated to any particular learning style. We did find that having preference towards a GUI is associated with AC score of Kolb’s model. This implies that learners with high AC score should be offered to personalize their GUI. Learning management system should offer such a GUI adaptation feature upon learning style detection. It would be beneficial to conduct learner’s satisfaction and learning outcomes measurement experiment that would put our research results to the further test. Based on two constraints of this research, a small sample and particular demographic features of participants, we stay cautious in generalizing our conclusions.
References
- Antonietti, A.; Ignazi, S.; Perego, P. (2000). Metacognitive knowledge about problem-solving methods. British Journal of Educational Psychology, 70(1), (pp. 1-16)
- Brophy, J. (1999). Teaching Educational practices series 1. International Academy of Education & International Bureau of Education, Retrieved from www.ibe.unesco.org
- Buch, K.; Bartley, S. (2002). Learning style and training delivery mode preference. Journal of Workplace Learning, 14(1), (pp. 5-10)
- Chen, S.; Macredie. R. (2002). Cognitive styles and hypermedia navigation: development of learning model. Journal of the American Society for Information Science and Technology, 53(1), (pp. 3-15)
- Coffield, F.; Moseley, D.; Hall, E.; Ecclestone, K. (2004). Learning styles and pedagogy in post- 16 learning, A systematic and critical review. London: Learning and skills research center.
- Eom, S. (2008). Strategies for Enhancing the Learning Outcomes For Web-Based Distance Education Students: Further Investigation of The Relationships between Motivation and Learning Outcomes, Proceedings of AIS SIG-ED IAIM 2008 Conference. Retrieved from www.sig-ed.org/IAIM2008/Proceedings/SIGed/Documents/73x.pdf
- Felder, R.; Silverman, K. (1988). Learning and Teaching Styles In Engineering Education, Engineering Education, 78(7).
- Ford, N.; Chen, S. (2000). Individual differences, hypermedia navigation and learning: an empirical study. Journal of Educational Multimedia and Hypermedia, 9, (pp. 281–312)
- Garrison, D.; Anderson, T. (2003). E-learning in the 21st century: a framework for research and practice. Abingdon: Routledge.
- Gilbert, J.; Morton, S.; Rowley, J. (2007). E-Learning: The student experience. British Journal of Educational Technology, 38(4), (pp. 560–573).
- Honey, P.; Mumford, A. (1986). Using your learning styles. Maidenhead, Berkshire: Honey Publications.
- Huber, M.; Shay, K. (2005). Real world lessons for making GUI design decisions that impact e-Learning, The eLearning Instructional Design Conference, Boston, USA.
- Imel, S. (2002). E-learning—trends and issues alert. (Report No-40). Washington, DC: Office of Educational Research and Improvement.
- Jain, S. (1996). The effects of individual cognitive learning styles and troubleshooting experience on the development of mental models in teaching a database query language to novices (Doctoral dissertation, George Washington University). Dissertation Abstracts International, 56, 3414.
- Jochems, W.; Van Merrienboer, J.; Koper, R. (2003). Integrated e-learning: implications for pedagogy, technology and organisation. Abingdon: Routledge.
- Kanninen, E. (2009). Learning Styles and E-Learning, Master of Science Thesis, Tampere University of Technology. (Unpublished master thesis). Retrieved from hlab.ee.tut.fi/video/bme/evicab/astore/delivera/wp4style.pdf
- Khattapanm, C.; Zaidel, M. (2010). Interfaces and Templates in Computer-Assisted learning: Students’ Assessments and Preferences. International Journal of Arts and Sciences. 3(14), (pp. 1-11), CD-ROM. ISSN: 1944-6934.
- Kolb, A.; Kolb, D. (2003). Experiential Learning Theory Bibliography. Cleveland: Experience Based Learning Systems.
- Liaw, S. (2008). Investigating students’ perceived satisfaction, behavioral intention, and effectiveness of e-learning: A case study of the Blackboard system. Computers & Education, 51, (pp. 864–873).
- Liaw, S.; Huang, H. (2007). Developing a Collaborative e-learning System Based on Users’ Perceptions. Lecture Notes in Computer Science, 4402, (pp. 751-759).
- Liegel, J.; Janicki, T. (2006). The effect of learning styles on the navigation needs of Web-based learners. Computers in Human Behavior, 22(5), (pp. 885-898).
- Magoulas, G.D.; Chen, S.Y.; Dimakopoulos, D. (2004). A Personalised Interface for Web Directories based on Cognitive Styles. Proceedings of the 8th ERCIM UI4ALL Workshop, Vienna, Austria, 159-166.
- Metallidou, P.; Platsidou, M. (2008). Kolb’s Learning Style Inventory-1985: Validity issues and relations with metacognitive knowledge about problem-solving strategies. Learning and Individual Differences, 18(1), (pp. 114-119).
- Moore, K.; Aspden, L. (2004). Coping adapting, evolving: the student experience of e-learning. Update, 3(4), (pp. 22-24).
- Nussbaumer, L.; Guerin, D. (2000). The Relationship Between Learning Styles and Visualization Skills Among Interior Design Students. Journal of Interior Design, 26, (pp. 1-15).
- Paechter, M.; Maier, B.; Macher, D. (2010). Students’ expectations of, and experiences in e-learning: Their relation to learning achievements and course satisfaction. Computers & Education, 54, (pp. 222-229).
- Sadler-Smith, E. (1996). Learning Styles and instructional Design. Innovations in Education and Training International, 33, (pp. 185-193).
- Sein, M.; Robey, D. (1991). Learning style and
the efficacy of computer training methods. Perceptual & Motor Skills,
72(1), (pp. 243-248).