

![]()
Evaluation of a Tolerance of a Picture Distortion for Distance Learning using DV Movies
Takashi FUJIKI1, Masao MUROTA2, Yasutaka
SHIMIZU3
Faculty of Education, Nagasaki University_1
Graduate School of Decision Science and Technology, Tokyo Institute of Technology_2
Educational Resource Center, National Institute of Educational Policy Research
_3, Japan
Key words: DV movie, distance learning, distortion in picture quality, data loss rate, subjective evaluation
Abstract:
In this paper, a tolerance of distortion in picture quality was investigated quantitatively for a distance learning using a DV(Digital Video) movie. The subjective evaluations were made for a face-to-face type and a presentation type of lectures. By factor analysis, the five factors were obtained: "the picture quality", "the sensation of presence", "the comprehensibility", "the advantage of a distance learning", and "the teaching content".
The subjective scores on the factors of "the picture quality", "the sensation of presence", and "the advantage of a distance learning" were more sensitive to a distortion in picture quality than the other two factors. As a result, the data loss rate of DV movie should be less than 1.2% for a face-to-face type, and less than 2.5% for a presentation type of lecture.
1 Introduction
Many kinds of distance learning systems have been reported, for example the video conferencing system using an optical fiber[1], a study of the videophone-aided personal education system[2], an influence of a digital picture compression in distance learning[3], an evaluation of a distance education between an analogue satellite system and a digital satellite system[4], practices of distance learning using ISDN and PHS as low bit rate lines[5][6], and so on. Recently, a distance learning system with high quality movies were made on a trial by using DV (Digital Video), MPEG2 movie, and a gigabit network[7][8]. Especially a DV movie makes it possible to develop high quality system easily at low cost. The DVTS (Digital Video Transport System) was developed by WIDE project for distributing DV data through a network[7]. They conducted the experiment of DVTS between Japan and United States in 1998. Watanabe et al. carried out the distance lecture using the high quality movie on the gigabit network between Saga University and Keio University[8].
It is difficult to generalize a relation between picture quality and learning effects for a distance learning. For example, improving a picture quality results in a increase of data bit rates. When a communication line is shared, some of the data should be lost. Therefore a high picture quality will not be able to be obtained. Furthermore, a degree of picture distortion depends on an available bandwidth of a communication line, which changes all the time unpredictably. The lack of an objective standards for evaluation of picture quality makes difficult to compare picture quality between various distance learning systems. When a relation between picture quality and learning effects is investigated, the degree of distortion in picture quality must be controlled.
Some studies on the relation between picture quality and learning effect for the distance learning system were reported. Tamura et al. investigated a relation between a data bit rate and a subjective evaluation for digital movies from 64kbps to 1.5Mbps[3]. Ui et al. investigated a difference in picture quality between an analogue movie and an 1.5Mbps digital movie transferred via satellite system by subjective evaluation[4]. Watanabe et al. reported a relation between picture/audio quality and a packet loss for a distance lecture using a high quality DV movie on a gigabit network[8].
The purpose of this paper is to make clear a tolerance of distortion in picture quality for a distance learning using the DV movie based on the subjective evaluation. Two types of lecture were performed and a six levels of distorted movies were evaluated.
2 Methodology
Figure 1 shows the diagram of this study. The original DV movie was transmitted through the congested network environment. The distorted DV movie was recorded for a subjective evaluation. The purpose of this study is to make clear the tolerance of distortion in picture quality for distance learning using DV movies. In the following sections, the original DV movies, the congested network environment, and the subjective evaluation were described in detail.
2.1 Original DV Movies
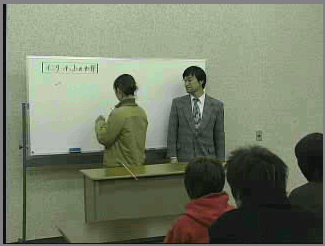
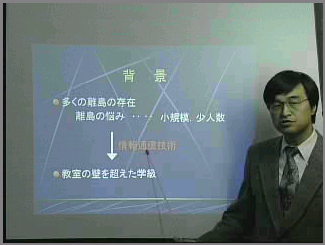
In addition to a network congestion, a degree of picture distortion depends on an amount of and a speed of motion of an original DV movie. In this paper, two types of original pictures were prepared. One is a face-to-face type of lecture, and the other is a presentation type of lecture. In a face-to-face type, a lecturer gave a normal class, where he and some of students wrote on a whiteboard and made gestures for explanations. On the other hand, in a presentation type, a lecturer used a presentation software on an personal computer, where he was almost motionless except for speaking and indicating a screen using a fescue.
Each type of lecture has three movies. Their titles and running time are listed in Table 1. In Fig.2, example still pictures from both type of lectures are shown.
| Lecture type | Running Time[sec] | |
| Face-to-face | Unit of Information amount | |
| World of Internet | ||
| Transmission speed | ||
| Presentation | Distance learning between Okuura - Himeharu | |
| About DVTS | ||
| Distance learning between Tsushima - Tanegashima |
2.2 Congested Network Environment
A configuration of a congested network environment to distort movies are illustrated in Fig.3.
The original DV movie is transmitted from PC for transmission to PC for reception by DVTS (Digital Video Transport System). The original movie is fetched from DV camera to PC for transmission via IEEE 1394 board. A transmitted movie is received by PC for reception, sent to DV camera via IEEE 1394 board, and recorded by DV camera.
A congestion traffic was generated by PC1 and transmitted to PC2. This traffic is a load for movie transmission. The congestion traffic was generated by using DBS (Distributed Benchmark System)[10]. The above four personal computers are connected to the 100Base-TX repeater HUB (GRAND JUNCTION FastHub 100lite).
The six levels of congestion were used for the experiment. By a congestion traffic, some amount of original movie data will be lost. The data loss rate was defined as an following expression, which means the ratio of the difference between the bit rate with no load and the bit rate with load to the bit rate with no load.
The data loss rate in experiments are shown in Table 2. When a load level is zero, which means no congestion, all the movie data is transmitted from PC for transmission to PC for reception. When a load level is 5, 8.7 and 8.3 % of an original movie data were lost for a face-to-face type and a presentation type, respectively.
The specifications of four PCs are listed in Table 3. The DVTS setting values are listed in Table 4.
| Face-to-face type | ||||||
| Presentation type | ||||||
2.3 Subjective Evaluation
The subjective questionnaire had 27 items about picture quality and class contents. Each item is evaluated on an ascending risk scale of 4 to 1 (4: I think so, 3: I think so approximately, 2: I don't think so approximately, 1: I don't think so). The evaluation was made for distorted movies (transmitted movies).
Twenty one undergraduate students participated in the experiment. The experimental protocol was as follows. First, a participant was explained the purpose and protocol of the experiment and got training session to observe the practice movies and answer the questionnaire. Second, he observed one of the original movies. Third, he evaluated the six distorted movies of this original movie in the order of distortion. In this evaluation, an instructions was given to participants to evaluate the distorted movie comparing with the original one.
| Factor Name | |||||
| 02. I didn't worry about block noise of the screen | |||||
| 01. I didn't worry about flicker of the screen | |||||
| 03. I felt the screen was sharp. | |||||
| 05. I felt an object on the screen moved smoothly. | |||||
| 12. I felt the TV screen was totally good. | |||||
| 04. I felt the screen was fine. | |||||
| 09. I didn't feel my eyes were tired. | |||||
| 10. I didn't feel tired psychologically. | |||||
| 06. I recognized an object and a scene on the screen well. | |||||
| 07. I had an interest in a scene and an object on the screen. | |||||
| 08. I felt an atmosphere of a scene and an object on the screen. | |||||
| 26. I felt a lecturer was standing by me. | |||||
| 25. I got the sensation of presence. | |||||
| 23. I had a scene of belonging to the class. | |||||
| 21. I had a sense of participation. | |||||
| 11. I felt as if I were on the screen. | |||||
| 27. I felt a class atmosphere through the screen. | |||||
| 14. I recognized clothes of a people on the screen. | |||||
| 15. I recognized a hairstyle of a people on the screen. | |||||
| 13. I recognized an expression of a people on the screen. | |||||
| 16. I recognized the presentation screen (white board or PowerPoint and all). | |||||
| 17. I would rather take distance learning than a face-to-face class. | |||||
| 20. I would learn better than a face-to-face class. | |||||
| 18. I thought this distance education system was good in a comprehensive manner. | |||||
| 19. I would like to attend a class using this system. | |||||
| 22. I thought the contents of the class was easy. | |||||
| 24. I was interested in the contents of the class. | |||||
| Contribution Ratio | |||||
| Cumulative Contribution Ratio |
3 Results and Discussion
3.1 Factor Analysis
The factor analysis was carried out on the data of a subjective evaluation with Principal Components and Varimax Rotation. The list of items, factor loading, and factor names are shown in Table 5. Five factors were employed by considering the change of eigenvalues.
By the items whose value of factor loadings are larger than 0.5, each factor was given a factor name as follows, "the picture quality", "the sensation of presence", "the comprehensibility", "the advantage of distance learning", and "the teaching content" as shown Table 5.
3.2 Data loss rate and subjective scores
A subjective score for each factor was defined as the mean value of subjective evaluations on the items which belong to the factor.
Figures 4(a)-(e) illustrate a relation between the data loss rate and the subjective scores. In Fig. 4, a symbol ** denotes significantly difference on the mean value by the level of 1%, and a symbol * denotes 5%.
As shown in these figures, when the data loss rate has the same value, the subjective scores of a presentation type is larger than a face-to-face type for "the picture quality", "the sensation of presence", and "the advantage of distance learning". On the other hand, the subjective scores of the presentation type are less than face-to-face type for "the comprehensibility".
The decreasing values of subjective scores are shown in Table 6. The decreasing value was defined as the difference between the maximum and the minimum subjective scores. As shown in Table 6, the three factors, "the picture quality", "the sensation of presence" and "the advantage of distance learning" have larger values than 1.0. However, the values for "the comprehensibility" and "the teaching content" are less than 0.7. This means that "the picture quality", "the sensation of presence" and "the advantage of distance learning" are more sensitively affected by a picture distortion.
picture quality |
sensation of presence |
advantage of distance learning |
teaching content |
:comprehen- sibility |
|
3.3 Torelance of Data Loss Rate
The data loss rates where the subjective scores are larger than 2.5, 3.0, and 3.5 were obtained from Fig. 4. The score 2.5 means the medium value of a subjective scores. Those values are listed in Table 7. In this table, x marks for "the sensation of presence" and "the advantage of distance learning" mean that a subjective score cannot be 3.5 even if there is no load on a network.
picture quality |
sensation of presence |
advantage of distance learning |
teaching content |
comprehen- sibility |
||
On "the picture quality", the tolerance of data loss rate should be less than 2.5% on a face-to-face type, and less than 6.4% on a presentation type in order to satisfy the condition that a subjective score is larger than 2.5. On "the sensation of presence", it should be less than 2.0% on a face-to-face type, and less than 3.0% on a presentation type. On "the advantage of distance learning", it should be less than 1.2% on a face-to-face type, and less than 2.5% on a presentation type. The tolerance for a face-to-face type becomes severer than a presentation type because a motion speed of a face-to-face type is faster than a presentation type.
On "the teaching content", the tolerance of the data loss rate should be less than 8.4% on a face-to-face type, and less than 8.3% on a presentation type in order to satisfy the condition that a subjective score is larger than 3.0. On "the comprehensibility", it should be less than 3.2% on a face-to-face type, and less than 2.2% on a presentation type for the condition that a subjective score is larger than 3.5. These results mean that the tolerance for a face-to-face type becomes easier than a presentation type on these two factors, which is contrary to the previous three factors.
3.4 Comparing with Related Works
The results of this study was compared with those of Watanabe et. al.[8]. Although their experimental condition was different from ours, it is worth to do. Their setting values of the DVTS were as follows: frame rate: 4 fps, packet length: 6(492 bytes), number of packets per 4 second: 6700. They pointed out that the packet loss should be less than 200 packets per a second to do a smooth distance lecture. The data loss rate for Watanabes' results were calculated from the above values. The desirable data loss rate for Watanabes' paper was less than 3.0%.
By comparison between this 3.0% and the results in Table 7, their result fits the subjective score of 2.5 (the presentation type) on "the sensation of presence". Furthermore, the data loss rates of 3.0 (the presentation type), of 2.5 (the face-to-face type) on "the picture quality", and of 2.5 (the presentation type) on "the advantage of distance learning" in Table 7 are comparable to their 3.0%. Therefore, the tolerance of the data loss rate of this study has the same order with the result of Watanabe et.al.
The mean value of the data loss rate on "the picture quality", "the sensation of presence" and "the advantage of distance learning" is 2.8%. This value is comparable to Watanabes' 3.0%. However, the tolerant data loss rate of this study is more extensive than Watanabes' result in comparison with "the teaching content" and "the comprehensibility". This is due to that "the teaching content" and "the comprehensibility" were not contained in the Watanabes' evaluation.
4 Conclusion
The experiment of the subjective evaluation was carried out using the distorted pictures with various data loss rate for the distance learning with DV movie. The following conclusions were obtained.
(1)From the factor analysis on the subjective evaluation, the following factors were obtained: "the picture quality", "the sensation of presence", "the comprehensibility", "the advantage of distance leaning" and "the teaching content".
(2)The data loss rate where the subjective score is larger than its medium value 2.5 on "the picture quality", "the sensation of presence" and "the advantage of distance learning" is 2.8%. This value is comparable to Watanabes' result.
(3)The subjective scores on "the comprehensibility" and "the teaching content" are not sensitive to the data loss rate.
(4)From the point of view for the factors on "the picture quality", "the sensation of presence" and "the advantage of distance learning", the tolerance of a face-to-face type is severer than a presentation type. This is because a face-to-face type contains faster motions than a presentation type.
The results of this study should be helpful to a development of a future distance education and an e-learning system.
References:
[1] Yasutaka SHIMIZU, Kunihiro SUETAKE: Long-Distance Transmission of University
Lectures. Jap. J. Educ. Technol. Vol. 8 No.3 pp.117-123, 1984 [in Japanese].
[2] Shin SHIROMA, Minoru NAKAYAMA, Kanji AKAHORI, Isao YOSHIDA, Seiji HATTORI,
Yasutaka SHIMIZU: Development and Evaluation of Videophone-Aided Personal Education
System. IEICE Trans. Vol. J75-A No.2 pp.226-234, 1992 [in Japanese].
[3] Takeshi TAMURA, Fumio SHIBUI, Takeshi KIKUKAWA: Some Influencing Factors of
Digital Signal Complexity in Distance learning. IEICE Trans. Vol. J75-A No.2 pp.235-243,
1992 [in Japanese].
[4] Osamu UI, Minoru NAKAYAMA, Yasutaka SHIMIZU: Evaluation of Two Different Delivery
Systems for Distance Education by Satellite. IEICE Trans. Vol. J80-D-II No.4 pp.892-899,
1997 [in Japanese].
[5] Koji OKAMURA, Masato TSURU, Takashi FUJIKI, Chiaki NAKAMURA, Takeshi IKENAGA:
Study on making remote class on internet practicable. JSiSE Trans. Vol. 14 No.3
pp.84-94, 1997 [in Japanese].
[6] Takashi FUJIKI, Masato TSURU, Takeshi IKENAGA, Chiaki NAKAMURA, Shinichi KAMOHARA,
Hideo KURODA: Practice and Evaluation of Distance Classes with ISDN and PHS on
Moral Education for Primary School. JSiSE Trans. Vol.15 No.4 pp.328-333, 1999
[in Japanese].
[7] WIDE PROJECT (2000) DV Stream on IEEE1394 Encapsulated into IP. http://www.sfc.wide.ad.jp/DVTS/
[8] Kenji WATANABE, Makoto OTANI, Hisaharu TANAKA, Yoshinori ISAGAI, Hiroki KONDO:
A REport of the Distance Classroom Using High Quality Video/Audio Stream on the
Japan Gigabit Network -An Analysis of the Influence of Packet-Loss on the Quality
of the Stream. Jap. J. Educ. Technol. Vol. 25 Suppl. pp.149-154, 2001 [in Japanese].
[9] mpeg2ts(MPEG2 over IP Transfer System). http://net.ipc.hiroshima-u.ac.jp/mpeg2ts/
[10] DBS: Distributed Benchmark System. http://www.aj3.net/products/dbs/
Authors:
Takashi FUJIKI, Master of Education.
Faculty of Education, Nagasaki University.
Bunkyo machi 1-14, Nagasaki city, Nagasaki, 852-8521 Japan.
t-fujiki@net.nagasaki-u.ac.jp
Masao MUROTA, Doctor of Engineering.
Graduate School of Decision Science and Technology, Tokyo Institute of Technology
Ohokayama 2-12-1, Meguro-ku, Tokyo, 152-8550 Japan.
murota@hum.titech.ac.jp
Yasutaka SHIMIZU, Doctor of Engineering.
Educational Resource Center, National Institute of Educational Policy Research
Shimomeguro 6-5-22, Meguro-ku, Tokyo, 153-8681 Japan.
yasu@nier.go.jp