

![]()
Graphical Programming and Educational Technologies
Petru-Adrian COTFAS1,
Doru URSUTIU1, Cornel SAMOILA2
1Department of Physics - Transilvania University of
Brasov,
2Department of Science of Materials - Transilvania University of Brasov, Romania
© EURODL 2001
Abstract
The quick evolution in the fields of knowledge, technology and communication has determined us to think more and more often about a strong reform of the “teaching systems”. It is taken into considering the usage of the information technologies in education and their correlation to the Open and Distance Learning systems.
Modern educational techniques cannot be conceived without the usage of a computer. That is why the usage of a computer by several teachers (which aren’t specialists in computer science: Mathematics, Physics teachers) implies the usage of different programming environments (programming languages), that allow the creation of some complex and reliable applications in a short period of time.
Key words
Graphical programming, educational technologies, signal
analyzer, MEM, Internet, virtual laboratory
Introduction
Graphical programming in
education
Conclusions
References
Introduction
A preoccupation for more and more researchers and teachers all over the world has become the usage of the information technologies in education and their correlation to the Open and Distance Learning systems. The most important topic for debating is the developing of some software that allows a reform of the educational system.
We are often tempted to develop our own software for our research and educational activities, this having a strong influence on the educational software. We believe that it is much more useful to use a professional and perspective software (here we have chosen LabVIEW), which allows us to have a high performance in our efforts to create a very well conceived educational software with an utility as wide as possible. So, we should pay more attention to it.
Due to the manner of programming, resembling to the creation of a bloc diagram, programming in a graphical programming language becomes easy and intuitive. Considering this motif, we believe that the usage of these inductive programming environments is profitable.
Graphical programming in education
Graphical programming (LabVIEW)
It was proved in a lot of publications that LabVIEW offers an extremely flexible programming and presentation support for data acquisition and computation. We try to extend this capability in the teaching field.
Due to the friendly user interface which can be fitted to the shape of a real instrument, the graphical programming language LabVIEW offers a continuity in the using of instruments already known to the users, by transposing their interfaces on the computer.
That’s the way in which a virtual instrument is created with the aid of a computer together with a data acquisition board or with the computer’s I/O port. So, the heavy, obsolete instruments which occupy a lot of space, can be replaced with a computer which can be used as being different instruments, depending on the programs that are implemented on it.
Benefiting of this advantage, altogether with the ones given by a computer, we can obtain a real virtual lab. This virtual lab could allow the simulation of studied phenomena in order to understand them and then check them up through measurements.
During the last months, National Instruments gave to the wide public a free application named LabVIEW Player (which has 16,5 Mb and can be downloaded from www.ni.com\labview\labview_player.htm). This application allows us now to develop other applications that can be accessed on the Web in order to be consulted by the interested people. The usage of this player will also allow us to share the knowledge and the experience regarding the automation and measurements, by creating some Virtual Instruments (VIs), especially created to be used and accessed on the Web.
Signal Analyze
Introduction
The present work intends to demonstrate the high efficiency of using the Graphical Programming Language G in the teaching-learning process (for example in Signal Analyze).
One of the most known methods for signal investigation consists in estimation of Power Spectral Density (PSD), signal’s power distribution function of frequency.
PSD can be estimated by the classical FFT analyze and by the new Maximum Entropy Method MEM.
FFT analyze algorithm can be easy implemented, need a small computation time, can be applied at a large signal classes, but in order to minimize the errors you need to apply a high number of spectrum mediation and this multiplies the acquisition time.
For signals like seismic signals, corrosion electrochemical
noise, phenomena whose measurement time is shorter, due to the inability to make the
necessary averages in order to apply the FFT algorithm, the MEM algorithm was developed
[2].
Applications
We have implemented the Maximum Entropy Method MEM in LabVIEW and compared the performances of this new algorithm with the traditional Fast Fourier Transform FFT [3].
The implementation of the two algorithms (MEM and FFT) has been done in two situations:
- Programs that are being run on a single computer;
- Server-Client application.
In the first case (Fig.1) we have presented the interfaces of the applications that are running on a single computer. In Fig.1. (a) it is presented the case of signal analyze using the two methods: MEM and FFT, the signal generation being simulated in LabVIEW, while in Fig.1.(b) the analyzed signal proceeds from an analog generator and it is being measured with the aid of a data acquisition board.
In the second case we have the possibility to run the applications in the network. The Server application it is being run on a computer that has a data acquisition board and it is connected to the network and the Client application can be run on another computer connected to the network.
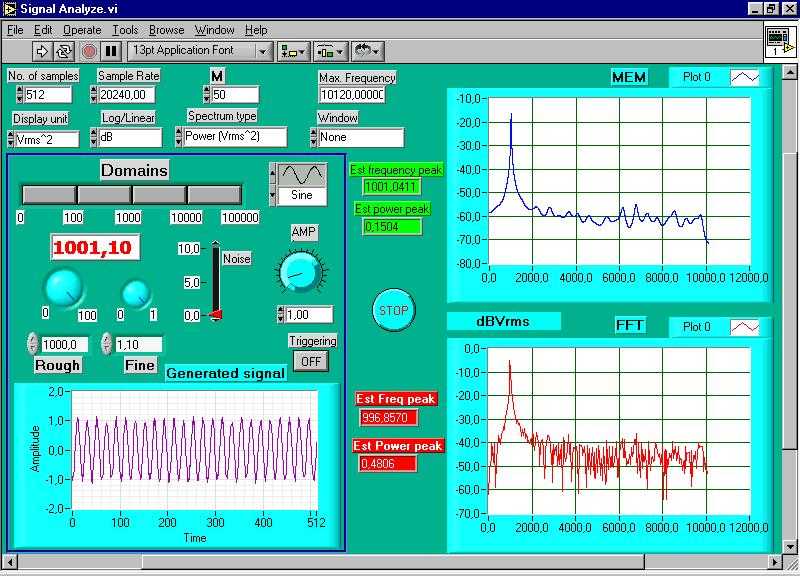
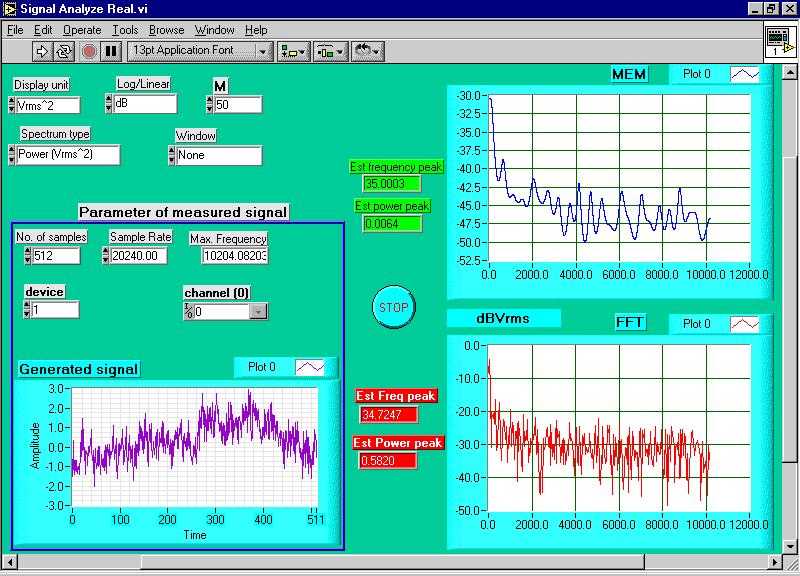
(a) (b)
Fig.1. Interface of application for MEM
analyzer:
(a) Simulated application
(b) Real application
So, any client connected to the network can study the signal measured with the Server application.
In Fig. 2, we present the user interface for the Server-Client application:
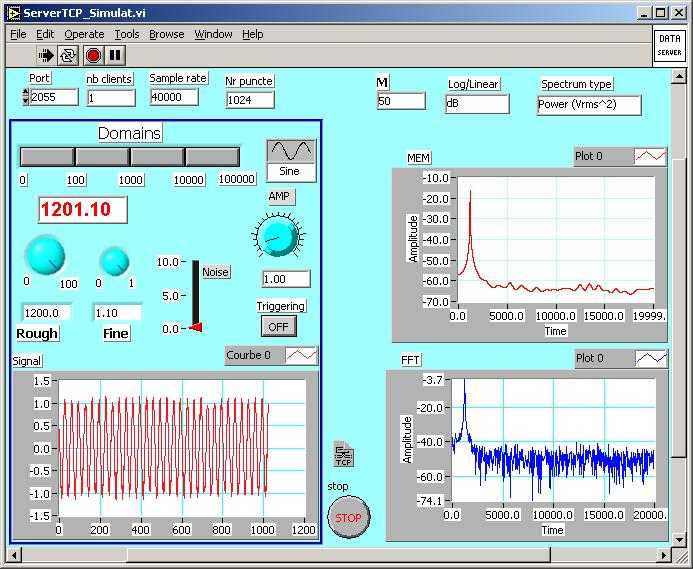
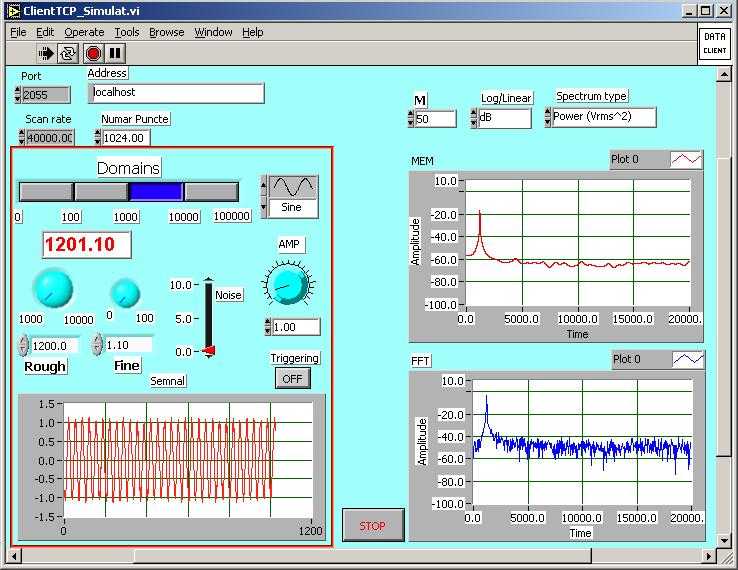
(a) (b)
Fig.2. Simulated
Server-Client application:
(a) Server application
(b) Client application
The Server application in the case of simulated signal generation can be modified so that at determined moments in time the signal’s shape and parameters would be modified. So, by accessing the Client application, the student could do some training in the signal analyze (being able to recognize the type and the shape of the signal, the amplitude, etc.).
Virtual laboratory
By uniting the two applications (the simulated application and the Server-Client application) with the applications presented at ICL99 (the applications for Mechanics: horizontal plane, inclined plane, horizontal throwing, collisions) and some other applications in the field of Optics (the study of lens, mirrors, prism, reflection and refraction) into a Web site (http://cvtc.unitbv.ro) we tried to create a small virtual laboratory used to study certain physical phenomena.
The creation of such Web site together with the afferent theoretic courses may lead to creation of a base for open and distance learning using as infrastructure the Internet. The advantage of this method is that the theoretic part from the courses is sustained and can be demonstrated even by the student by running the applications attached to the course.
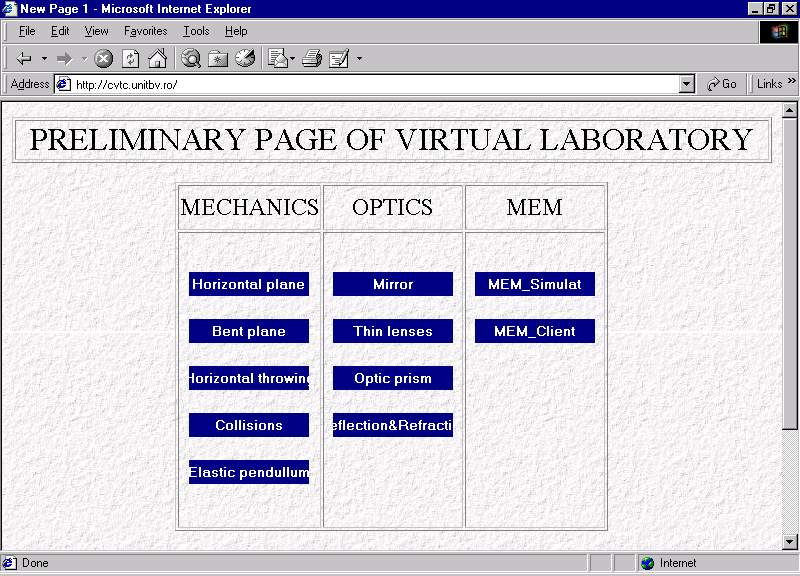
Fig.3. Web site with the application for Virtual Laboratory
Besides the educational field in which we use the applications presented as part of the virtual lab, we also have the possibility to use some of these applications in the research field. For example, the application for signal analyzing is often being used in several research fields. Using this kind of applications, the measured or analyzed data can be accessed by different researchers situated at long distances one from another.
Conclusions
LabVIEW is a programming environment in which the student can easily understand the experiment, the program and even bring modifications. Our efforts to create a pleasant environment, in which the student can distantly interact with the experiment, modify it as he likes, use it as a support for calculus in his own exercises, have been more and more outlined due to the opening given by the launch of LabVIEW Player.
In certain situations, if it is desired, a complex application can be integrated, controlled by Internet and assisted with a video camera [1]. LabVIEW offers the support for developing such applications, which can definitely be joined under the title “Virtual lab”.
References
- Stephen U. Egarievwe, Adepeju O. Ajiboye, Gautam Biswas, Oseoghaghare K. Okobiah, La Keisha A. Fowler, Sean K. Thorne, W. Eugene Collins “Internet Application of LabVIEW in Computer Based Learning”, EURODL 2000;
- U. Betocci, J. Frydman, C. Gabrielli, F. Huet, M. Keddam “Analysis of Electrochemical Noise by Power Spectral Density Applied to Corrosion Studies” J. Electrochem. Soc., Vol.145, No 8, August 1998;
- P. Cotfas, D. Ursutiu, D. Cotfas, C. Samoila “Implementarea Metodei Entropiei Maxime in LabVIEW” RIV Anul III, Vol. III, Nr 3(11), toamna 2000, ISSN 1453-8059;
- D. Ursutiu “Initiere in LabVIEW Programarea grafica in fizica si electronica”, Editura Lux Libris, Brasov, 2001;
- P. Cotfas, D. Ursutiu, C. Samoila “Using LabVIEW in Computer Based Learning”, “Interactive Computer aided Learning Tools and Applications“ Ed. M.Auer and U. Ressler, ICL99 Workshop, ISBN 3-7068-0755-6;
- P. Cotfas, D. Ursutiu, C. Samoila “Creating a Virtual Lab using LabVIEW” International Conf. TICE 2000, 18-20.10.2000, Troyes, France;
- P. Cotfas, D. Ursutiu, C. Samoila “Virtual Laboratory and Virtual Instrumentation” ,“Internet as a Vehicle for Teaching“, Ed. Susan English, Mihai Jalobeanu, Nicolaie Nistor, Romanian Internet Learning Workshop “RILW2001“, august 11-20 2001, ISBN 973-85023-7-3.
Authors
Cotfas Petru , Assistant Drd., Transilvania University of Brasov, Department of Physics,
1 Colina Universitatii Brasov, pcotfas@unitbv.roUrsutiu Doru, Conf. Dr., Transilvania University of Brasov, Department of Physics,
1 Colina Universitatii Brasov, udoru@unitbv.roSamoila Cornel, Prof. Dr. Ing., Transilvania University of Brasov, Department of Science of Materials,
1 Colina Universitatii Brasov, csam@unitbv.ro