

![]()
Basic Requirements for Interactive Web-based Courseware
Frank Hanisch
University of Tübingen, Graphical-Interactive
Systems (GRIS), Germany
© EURODL 2000
Introduction
Interactive web-based courseware
Structure, content and design
The online assistant
A toolkit for higly interactive content
Case studies
Conclusion
References
Abstract
The needs for interactive, hypermedial courseware as well as for their rapid development and easy enhancement imply the development of problem-based authoring and programming tools. The basic requirements for such tools are interdisciplinary. This article describes general concepts to meet the task of providing international, consistent, adaptive and highly interactive content.
An architecture of a template-driven authoring tool is presented that is based upon a layered database model. An online assistant with an integrated state machine provides additional dynamic Web content. More complex visualizations and experimental set-ups are achieved through the integration of virtual experiments. It will be shown that the latter ones require a toolkit of basic reusable software components.
Key words: Hypermedia, Courseware, Virtual Experiments
1 Introduction
Planning, implementing and evaluating interactive, hypermedial learning environments are expensive and complex tasks. The needs for rapid development and easy enhancement of Web-based courseware imply the development of problem-based authoring and programming tools. Based on former experiences with courseware for Computer Graphics [7] this article describes basic requirements for such tools with special regards to hypermedial and interactive issues.
The presented architecture [4] meets the interdisciplinary problems of international, consistent and adaptive content by strictly separating content, structure and design and organizing them within a layered database model. In- and output tasks are smartly solved by templates: template-defined online assistants supervise the Web-based input of core data and design templates master the automatic generation of the entire courseware. Templates allow to make out consistent cross-linked indices of all different logical components, such like keywords, illustrations, virtual experiments, citations, exercises, etc.
To face the demand for better understanding of complex algorithms or complicated relationships virtual experiments provide the learner with highly interactive visualizations. Enabling the learner to experiment with all essential parameters of a topic and visualizing all essential relationships properly not only helps to illustrate problems or to increase the learner’s motivation but also shortens his learning process through intuitive playing.
Virtual experiments can be arranged by connecting software components to a logical network. Therefore a toolkit of reusable basic components is needed that allows the development of many different but uniform virtual experiments for particular course topics that could only be presented long winded by traditional teaching tools like textbook, hypertext, video or audio. Furthermore, with such a toolkit both teacher and learner may individually build up their own set-ups to visualize or deepen certain aspects.
The benefits of such an approach are demonstrated with two case studies: an Electronic Webmaster and courseware for Visualization in Bioinformatics.
2 Interactive Web-based Courseware
Web-based courseware integrates all different aspects of a topic in one uniform and platform-independent framework. Usually, different media documents like texts, images, videos, audio or programs are therefore connected together to a so-called hypermedial environment [3], mostly by using the meta languages Html or XML [9]. It is common practice to organize the core data within databases [10]. Such an approach allows related objects to be connected consistent and automatically (refer to chapter 3). The learner may be guided through the learning content by providing different reading paths and different approaches to the content, e.g. theoretical, technical or experimental [7]. In general, the content should adapt to the learner [2].
Authoring tools offer a graphical software environment for the development of such environments and allow for editing structure, content and design visually at ease. Scripting programs allow even more complex procedures. Nowadays, two different classes of authoring tools can be distinguished: courseware authoring tools or content managers. Examples are WebCT, TopClass, Lotus LearningSpace or Infopark NPS; an overview and comparison is found in [12].
Both classes lack in providing highly interactive content. Mostly, only gap filling, multiple-choice tests and simple structured graphics are possible. But, complex relationships like equations in mathematics or algorithms in computer graphics have to be visualized properly within an interactive experimental set-up [11], resulting in the inclusion of computer graphics [7]. SMIL [12] faces with the needs for synchronization and interaction between hypermedial elements, but is not a popular standard. Commercial authoring tools like Asymetrix Toolbook or Macromedia Director allow for simple virtual experiments together with scripting abilities, but more sophisticated experimental set-ups or simulations still have to be implemented in Java applets [12]. Today only Java allows the embedding of programs into Web-based courseware in a platform-independent way. It provides an object-oriented model for reusable software components (JavaBeans [9]) that we will use to build a toolkit as base for all our virtual experiments (see chapter 5).
3 Structure, content and design
3.1 Data separation and organization
Strictly separating structure, content and design is a key towards easy creation, modification and extension of courseware. It enables the author to concentrate on the pure contents only and, using design templates, to define a uniform appearance for each object of the same type. The same is true for navigation issues. Normally, many changes in navigation and design will take place between the first creation step and the final evaluation. In an online courseware, such changes have to be completed quickly and effortless.
To organize the core data, common database technologies together with high-level interfaces like JDBC (Java Database Connectivity) provide great functionality and flexibility. Data may be spread over many different databases that may differ in their functionality (e.g. in object-types). Therefore, we implemented an abstract database manager to interact with the underlying databases.
Another task of online courseware is to provide its data in different versions like multi-language contents for internationalization or multiple levels of detail for user adaption. In [4] we suggest a layered database model, where different versions of data correspond with different database layers. All layers are ordered and stacked; if the requested information cannot be located on the current layer, the database manager automatically moves on to the next one. Language-independent data like structure, images or videos without text and audio are stored on one layer only.
3.2 Templates
A generator component creates the entire courseware automatically from its content, structure and design information. The data may consist of many different types of hypermedia elements, like document chapters, links, illustrations, experiments or didactical elements like multiple-choice questions. A set of design templates, either given textually or programmed in Java, defines their appearance. The underlying template parser enriches the standard Html or XML with algorithmic functionality like variables, if-clauses and loops as well as image or file operations.
For instance, the design template registered for illustrations imports and converts the image and marks it with a watermark. Templates are context-dependent: if the illustration is placed within the main text, the image is displayed directly at that position. Otherwise, if the illustration is placed in the text margin, a thumbnail with an hyperlink to an additional page is created where the image is displayed together with its subtitles and references back to all chapters that contain the illustration. The template is defined textual - modifications to the design are trouble-free and require no deeper knowledge of programming tools. On the contrary, templates for more complex tasks like the creation of a member’s business card may only be realized through low-level programming.
4 The online assistant
4.1 State Machine
Now that the framework of a courseware is generated, we have to solve to the task of providing a user interface for data input. In the case of web-based courseware, authors should be enabled to input core data online - right on the spot. The standard approach uses Html forms together with CGI programs. A more sophisticated solution will use Java Servlets [13]. Servlets are server-side Java classes with improved performance compared to CGI programs, especially since a servlet is capable of handling many requests in parallel.
The author should be guided in the data input process as good as possible. Therefore, the task is to implement an online assistant that enables the author to select existing core data or create a new entry, afterwards guides him through several data input steps and closes with a preview and validation step. Between selection and preview, the online assistant has to allow backward steps (undo facility) and step-over functionality (default values). Figure 1 visualizes the state machine of the online assistant. Note that the validation step is reached only through the preview step.
User authorization should only be performed once per a given time interval, or, if acceptable, unlimited by using the author’s IP address. All given core data is stored not only after validation but also for each step, and, for reasons of reliability, not by using Java-Script or Browser Cookies (limited to one session or one workstation) but within a separate so-called IP database. The following algorithm assures the consistence of the IP database:
1:  if (lastState == select) IP =   DB
2:  if (action == inputi)    IPi =  stepi.data
3:  if (action == send)      DB  =   IP
4:  stepi.data   = IPi
Jumping from the selection step to any other data input step causes the online assistant to request existing core data from the abstract database manager, who in turn loads the specific core data from the underlying databases to the IP database (line 1). Each step displays the appropriate IP data segment (line 4). During the different data input steps, the author may overwrite existing or default data within the IP database (line 2). Validating the preview results in storing the IP database back to the main databases (line 3).
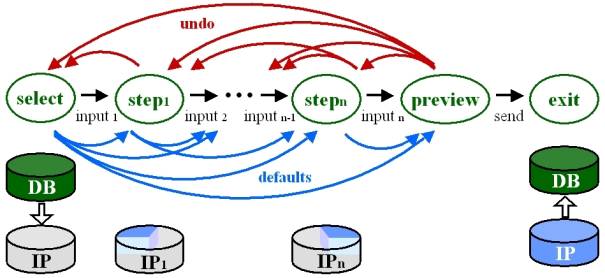
Figure 1: The online assistant’s state machine offers undo facility and default values. Database actions are displayed below the corresponding steps.
4.2 Base Servlet
In general, online assistants will differ for each type of hypermedia element. We developed a base servlet that provides all type-independent functionality – reducing the task of implementing a new assistant to defining the textual templates for each step and low-level programming of critical database actions or handling flawed data. Apart from the template parser and request-response functionality the base servlet defines global properties for all online assistants, performs the upload of local files, image processing, and, in case of the final validation or an unexpected error, automatically notifies the webmaster.
5 A toolkit for highly interactive content
5.1 Virtual Experiments
Until now we described static and dynamic web environment only. The integration of an hypermedial element like an illustration, video or audio requires a template-driven online assistant for that type of element, and, on the other hand, a registered template for that type of element queried by the generator. So far, the described approach automates the consistent visualization of all essential relationships between hypermedial elements.
But non-interactive media types will not be sufficient to visualize and learn complicated relationships or complex algorithms. Courseware will also have to include elements like virtual experiments that allow interacting with all essential parameters of a topic and visualizing all essential relationships properly [4]. Normally, many different virtual experiments have to be implemented, and most of them will use the same type of parameter or relationship again and again. By encapsulating such basic elements into basic reusable software components we end up in a so-called toolkit for virtual experiments that simplifies the consistent in-depth visualization of parameters and relationships within one hypermedial element.
Instead of low-level programming virtual experiments may now be constructed within a visual builder tool by choosing a subset of the toolkit’s components, modifying their properties and connecting them to a logical network. Such an abstraction requires much more efforts in creating the first version of a toolkit, but in turn spares time in development of many different virtual experiments with a uniform appearance and behavior and in addition enables novice programmers to modify or extend existing set-ups.
The programming language Java already offers many smart components for mathematics, geometry (Java 2D, Java 3D) and graphical user interfaces (Java Swing). Not included yet are basic components for creating and visualizing advanced mathematical properties and their relationships (e.g. geometrical or physical formulas) as well as mechanisms that allow interacting with them. We compensate their absence by implementing our own packages for geometry, computer graphics, and adjusted graphical user interfaces (figure 2). The next three chapters present these packages.
5.2 The Geometry Package
Splitting up the geometric type, the visual representation and the constructive definition of the components is valuable both in use and performance [8]. Not only that one can switch the appearance of an object or an algorithm at ease, it also allows to reuse algorithms. According to this the package consists of three parts: geometric objects, constraints and renderers.
Geometric objects (scalar, point, line, conic, etc.) extend the existing Java geometry objects. Constraints implement an algorithm, respectively the functionality of these geometric objects. Such constraints assure the consistency of relationships between some objects, for instance a point lying on a line. On demand, a constraint will update its output objects if any of its input objects have changed. Objects and constraints represent purely logical elements without visual representation. A line for example may be visualized as a thin stroke, a dotted stroke, an arrow, or any other suitable graphical appearance. Therefore, a renderer assembles some Java graphics methods to visualize a specific object - both Java 2D and Java 3D already provide sophisticated graphics engines for that task.
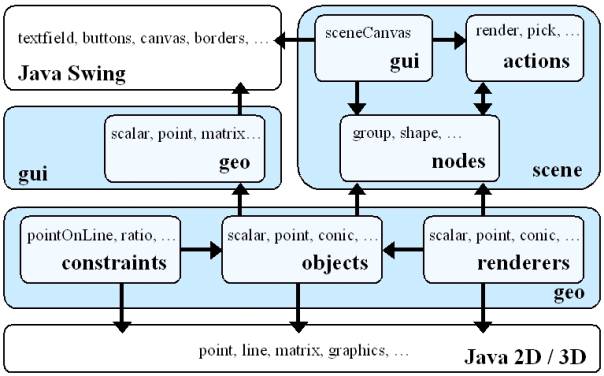
Figure 2: Java packages for graphics and graphical user interfaces neither support advanced mathematics nor allow complex visualizations and intuitive interaction. We therefore include additional concepts of dynamic geometry and computer graphics.
5.3 The Scene Graph Package
Using such principles only will result in pure visualizations. More interesting and interactive set-ups can be achieved by the incorporation of a computer graphics paradigm: the scene graph [13]. Already implemented in Java 3D [15], this acyclic directed graph completely describes the entire scene and allows to perform arbitrary actions on it. Scenes are built by connecting separate scene nodes, which contain geometrical objects, attributes or viewing information. As Java 2D misses the scene graph paradigm, we present the following scene graph package that consists of scene nodes, scene actions and a scene canvas.
Nodes may be container nodes to build the scene graph hierarchy, shape nodes to encapsulate a geometric object, affine / perspective transformation nodes or rendering attributes. A shape node will use default renderers for its geometric object. Renderers are exchangeable and any shape node may be decorated with an arbitrary number of geometric object-renderer pairs. Note that renderers have two states that correlate with the two states of a scene element: selected or deselected (instead of having two different renderers with, in most cases, nearly the same functionality). Also notice that Java 3D does not include a renderer concept.
Scene actions traverse the scene and perform a specific task, e.g. to render the scene, pick or drag some elements or calculate the bounding box. The action itself keeps track of the current traversion state that is needed e.g. to accumulate transformation nodes.
The scene canvas provides the graphical user interface for such a graph; it defines default actions for mouse input and automatically renders the scene if there's a need for.
Now that we have such a scene graph, we can start to build specialized scene nodes, in most times represented again as a scene graph. Those so-called nodekits [13] simply inherit the abilities of its members; in particular they already know how to visualize themselves and how to interact with user input. All that is left to do is to add non-default actions or new functionality. In [4] we introduced a classification of basic components.
5.4 The Graphical User Interface Package
After creating the geometric objects and relationships (constraints), combining them with renderers and including them in a scene graph for proper visualization and interaction, the last thing left to do is to provide a proper graphical user interface. The scene graph itself is rendered automatically within the scene canvas. Therefore, a virtual experiment only has to provide elements to modify or display geometric objects and relationships in non-graphical form. We extended Java Swing elements to directly control those objects, like an advanced text field for a scalar value or a recorder element to change parameters in time. We found it necessary for experimental set-ups to encode information both in graphical and textual form to deepen the topic intuitively together with providing the nomenclature. The same is true for interaction: the user should be allowed to modify essential parameters not only textual but also visually where he would expect it: directly in the scene.
Lastly, we developed a base applet for all virtual experiments similar to the online assistants’ base servlet. It provides functionality to toggle between applet and application mode (either embedded within a hypertext page or within a new frame), creates a basic layout and design with copyright information and optionally allows sending messages to a server that we plan to use for tutoring and evaluation reasons.
6 Case Studies
6.1 Electronic Webmaster
The first case study presents an Electronic Webmaster [5] for the creation and maintenance of our institute’s homepage. Several templates define the institute-specific outlook; included are templates for the staff, areas of research, projects, seminars, vacancies, gallery and bibliography. For instance, a member’s personal page with all information that belongs to this person is automatically generated together with personal bibliography (if available, with hyperlinks to the full papers) and a high-resolution business card. The core data is either modified directly within the underlying databases or, in most times more convenient, via online assistants.
After the introduction of the system we noticed a stronger participation of the members in the data input step, which in turn further disburdened the former human Webmaster and in fact altered him into a Web editor. As main reasons for the voluntary contributions we see the assisted online input and the chance of getting an automated up-to-date personal homepage. Another motivation might be the automated bibliography that is searchable online and is also used to generate the bibliography list of the institute’s annual report automatically.
6.2 Courseware for Visualization in Bioinformatics
The second showcase, courseware for Scientific Visualization in Bioinformatics [6], demonstrates the inclusion of highly interactive content. The main goal of the courseware is to teach the core topics of visualization [1] with special respect to computer graphics algorithms. The course consists of 30 hours of lectures and 26 hours of practical exercises and will start at our department in 2000. The main target audience will be students of Computer Science or Bioinformatics with an intermediate diploma and programming experiences.
Although we also improved self-learning aspects and integrated new templates for gap-filling or multiple-choice tests, automated indices of all keywords, illustrations, literature and a glossary, the main task was to provide teacher and learner with virtual experiments that enables them to visualize an algorithm, interact with essential parameters and modify the experimental set-up to deepen certain aspects. Structural lessons ask the learner to built up or complete a network of basic components to match a requested task. To illustrate low-level programming, some components are given as programming exercise.
To reveal the ease and clarity of low-level programming with the described basic software components, we give a very simple outline of source code for the definition of an affine combination C=A+s*(B-A) of three points A, B, C with a scalar value s.
- public class MainClass extends BaseApplet {
- public void init() {
- new PointOnLineConstraint(s, AB = new GeoLine(A, B));
- new RatioConstraint(s, C, AB);
- new BoundConstraint(s, new GeoScalar(0), new GeoScalar(1));
- rootNode.addNode(cNode = new ScenePoint(C));
- rootNode.addNode(new SceneLine(AB));
- sceneCanvas.setNode(rootNode);
- cNode.getRenderer().setProperty("radius", 2.0);
After creating the first constraint (line 3) the point C will be recalculated for any change of A or B. Inversely, the equation s=|C-A|:|B-A| have to be fulfilled for any change of point C (line 4). Lastly, we require s to lie in the [0,1]-interval (line 5). Now that the geometry is fully defined, the scene is constructed with a scene graph (line 6 and 7) and visualized within a scene canvas (line 8). As the latter already performs standard actions like picking and dragging, the user may now modify A, B or C (that modifies s) interactively. The base applet (line 1 and 2) already performs the task-independent initialization and all that is left to do is to change the standard decoration (line 9) and create a user interface, e.g. to reset the scene. The resulting virtual experiment is shown in figure 3, together with a more sophisticated one [4], that use several nodekits to visualize a raycasting algorithm.
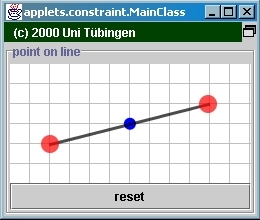
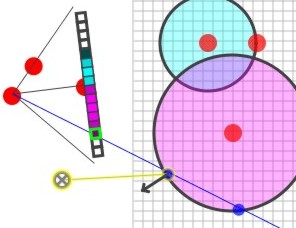
Figure 3: Two highly interactive virtual experiments created by connecting basic software components. The left one demonstrates a point-on-line constraint and is described in chapter 6. The right one visualizes a more complex raycasting algorithm.
7 Conclusion
In this paper we presented interdisciplinary concepts for the design and implementation of interactive Web-based courseware. We strictly separated structure, contents and design and organized the core data in a layered database model. While the courseware generation is performed automatically, comfortable online assistants supervise the data input. Both of them are template-driven.
Highly interactive Web content is realized with virtual experiments. A virtual experiment is constructed by connecting a subset of a toolkit with basic software components to a network. In order to enhance existing Java 2D and Java 3D functionality, we developed three packages of basic components in the field of geometry (objects and relationships), computer graphics (visualization and interaction) and graphical user interfaces.
References
[1] Domik, G.: Visualization Viewpoints, in: Rhyne, T.M.; Treinish, L. (eds.): IEEE Computer Graphics and Applications, p. 16-19, July/August 2000
[2] Encarnação, L.M.: Concept and realization of intelligent user support in interactive graphics applications, University of Tübingen, 1997
[3] Halasz, F.; Schwartz, M.: The Dexter Hypertext Reference Model, CACM 37:2, p. 30-39, February 1994
[4] Hanisch, F.; Klein, R.: Challenges in the Development of Web-based Courseware using Virtual Experiments, in: Hoffmann, M.H.W. (ed.): Innovations in Education for Electrical and Information Engineering (EIE), Proceedings of the 11th annual conference of the EAEEIE, Abteilung Mikrowellentechnik, University of Ulm, April 2000
[5] Hanisch, F.: Electronic GRIS Webmaster, URL: http://www.gris.uni-tuebingen.de, Graphical-Interactive Systems (GRIS), University of Tübingen, 2000
[6] Hanisch, F.: Courseware for Visualization in Bioinformatics, URL: http://www.gris.uni-tuebingen.de/projects/bioinf, Graphical-Interactive Systems (GRIS), University of Tübingen, 2000
[7] Klein, R.; Hanisch, F.; Strasser, W.: Web based Teaching of Computer Graphics: Concepts and Realization of an Interactive Online Course, URL: http://www.gris.uni-tuebingen.de/projects/grdev, in: M. Cohen, SIGGRAPH 98 Conference Proceedings, Addison Wesley, 1998
[8] Kortenkamp, U.: Foundations of Dynamic Geometry, Swiss Federal Institute of Technology Zurich, 1999
[9] Meißner, K., Wehner, F.. Ein Dokumentenmodell für Kursdokumente in Webbasierten Virtuellen Lernumgebungen, in: Engelien, M.; Homann, J. (eds), Virtuelle Organisation und Neue Medien - Workshop GeNeMe99, Eul-Verlag, Lohmar, 1999
[10] Mengel, M: IDEALS – task-oriented authoring for learning and training used in SME, Abstract of Online Educa 1998, Berlin, 1998
[11] Owen, G.S.: Teaching Computer Graphics as an Experimental Science, Eurographics Workshop on GVE, 1994.
[12] SofTec NRW: Softwaretechnische Anforderungen an multimediale Lehr- und Lernsysteme, URL: http://www.uvm-nw.de, September 1999
[13] Strauss, P.S.; Carey, R.: An object-oriented 3D graphic toolkit, in: Computer Graphics Siggraph 92, p. 341-349, ACM Siggraph, July 1992
[14] Sun Microsystems: Java™ Servlet Specification, v2.2, Sun Microsystems, Inc., 1999
[15] Sun Microsystems: Java 3D™ API Specification, v1.2, Sun Microsystems, Inc., April 2000
Author
Frank Hanisch, Dipl.-Inform.
University of Tübingen, Graphical-Interactive Systems (GRIS)
Auf der Morgenstelle 10 C9, 72076 Tübingen, Germany
Frank.Hanisch@WSI-GRIS.Uni-Tuebingen.DE