

![]()
Multimedia Educational Software in
Europe
Findings from the MESO observatory project
The MESO consortium has been established, with the co-ordination of SCIENTER, to provide technology, strategic and legal/regulatory/financial watch on the European market of educational multimedia and software. It includes the following organisations: EDEN, EDRU - The Tavistock Institute, FIM-Psychologie, Guildford Educational Services, IDATE, Institut für Informationsökonomie und Neue Medie (IENM), Knowledge Connection Corporation, Lambrakis Research Foundation, ORAVEP, ORFEUS, RAI.
Published by permission of the European Commission, DG XXII, and the
Project Coordinator, SCIENTER
© 1999
Abstract
Penetration of technology
Quantitive development of supply
Use of ICT in education and training
Market mechanisms at work
Synthesis
In addition to the main findings described in this paper, we present three extracts from the MESO reports:
- The European multimedia market – dynamics and expectations (1997 report)
- European multimedia - country by country
- Characterisation of demand segments
You may download all three as zipped Word documents by clicking here .
Abstract
This paper presents some of the major findings from the MESO Project for DG XXII of the European Commission. It represents the result of two years of collective efforts in establishing a permanent observatory on the market, the policies and the general conditions for the development of multimedia products and services for education and training. The basic content of the paper is drawn from the MESO Final Report and from a range of national surveys conducted within the MESO project. The full final report is available at the MESO web site.
Key words: educational multimedia, market development, supply, technology, policies
The Final MESO Report aims at providing information on the market, the policies and the general conditions for the development multimedia products and services for education and training.
Three main segments are analysed: Education, Home and Training.
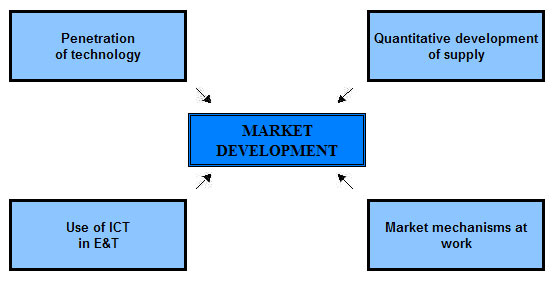
In order to assess the degree of multimedia market development in these segments, at European level, four relevant dimensions have been considered:
- Penetration of technology
- Quantitative development of supply
- Use of ICT in education and training
- Market mechanisms at work
Penetration of technology
In general terms, Europe still presents a fragmented map in terms of technological penetration, though strong signs of convergence are registered in the training and education sector, mainly due to the new public and or public/private initiatives undertaken in order to foster the introduction of multimedia tools in the schools and in public offices.
Differences are mainly registered between northern and southern European countries; the factors responsible for these differences seem to be the following:
- southern European markets are relatively younger
- there is a relatively negative attitude among potential users (low demand in France, Spain, Germany and Greece)
- private initiatives have not been so strong in promoting the diffusion and use of new technologies
- public policies in this field are relatively young and have not always produced the expected results
A further inhibiting factor, which is related to users’ attitudes, is the low level of investment in this sector. In general terms, northern European countries seem to be more capable than southern ones in promoting familiarity with new technologies in the households. The measures taken are various: education, access to public institutions (libraries and museums) and continuous provision of the best-of-the-art ICT infrastructure.
Another relevant factor that accounts for a higher or lower degree of IT penetration is national average income levels, as shown in the following table.
Relationship between GDP and technological penetration in the home and education sector
|
Per capita GDP (ECU) |
IT per capita expenditure (ECU) |
IT%GDP |
ICT per capita expenditure (ECU) |
ICT%GDP |
Number of PCs per 100 population |
Telecom equipment market value (MECU) 1997 |
Mobile subscribers/ |
Internet on line users (%) 1998 |
Cable TV subscribers/ |
|
| Austria | 23,417 |
477 |
2.08 |
931 |
4.07 |
16 |
582 |
7.42 |
5.5 |
28.2 |
| Belgium/ Luxembourg |
21,787 |
511 |
2.39 |
1,026 |
4.80 |
15 |
600 |
4.71 |
6.4 |
88.5 |
| Denmark | 27,415 |
819 |
2.98 |
1,482 |
5.39 |
33 |
493 |
26.52 |
16 |
41.0 |
| France | 21,716 |
538 |
2.52 |
1,013 |
4.75 |
16 |
4,974 |
4.29 |
6.0 |
10.2 |
| Germany | 23,708 |
511 |
2.15 |
1,029 |
4.33 |
19 |
8,045 |
6.70 |
8.7 |
47.5 |
| Greece | 9,640 |
85 |
0.88 |
396 |
4.11 |
12 |
403 |
4.89 |
1.0 |
0.1 |
| Ireland | 16,108 |
321 |
2.08 |
920 |
5.96 |
15 |
328 |
7.38 |
11.0 |
49.0 |
| Italy | 17,430 |
264 |
1.46 |
698 |
3.85 |
9 |
3,881 |
11.21 |
4.1 |
0.1 |
| Netherlands | 21,047 |
601 |
2.94 |
1,177 |
5.76 |
26 |
1,373 |
6.50 |
8.3 |
91.5 |
| Norway | 29,716 |
760 |
2.66 |
1,427 |
4.99 |
32 |
511 |
28.66 |
13.6 |
39.4 |
| Portugal | 8,600 |
130 |
1.42 |
447 |
4.88 |
13 |
506 |
6.75 |
1.9 |
3.2 |
| Spain | 12,287 |
173 |
1.42 |
465 |
3.80 |
8 |
1,620 |
7.64 |
6.6 |
15.9 |
| Sweden | 23,333 |
795 |
3.47 |
1,427 |
6.22 |
29 |
1,161 |
28.09 |
27 |
42.4 |
| Switzerland | 34,164 |
1,068 |
3.21 |
2,012 |
6.06 |
32 |
1,228 |
9.39 |
12.01 |
75.4 |
| United Kingdom | 16,187 |
536 |
3.38 |
993 |
6.26 |
21 |
4,431 |
11.59 |
9.0 |
7.3 |
Source: MESO elaboration of data from different sources (Meso Report 1998, Dataquest; EITO 1998, Nua 1998)
By the way, a general positively increasing trend for the European countries as a whole can be noticed, as far as technical endowment is concerned. As shown in the following graph, the most impressive variations in IT market growth for the year 1997/98 are noticed in countries like Greece (12.6%), Spain (11.9%) and Portugal (11.6%). This is certainly interesting especially if related to the low market value of most of these countries, and it is probably due to the fact that countries characterised by a not yet fully developed market are investing more than countries such as Denmark, for instance, which can already count on a quite developed market. The same situation can be observed in the Telecommunication market, as evidenced in the following graph.
IT Market Growth 1995-98
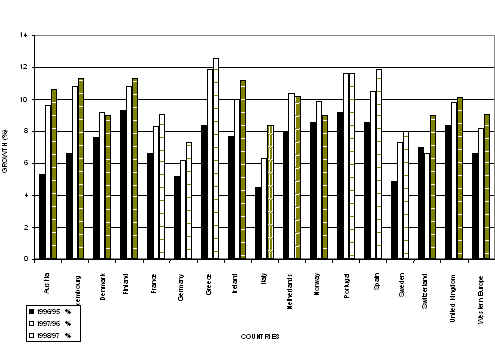
Source: MESO elaboration from EITO 1998 data
Another consideration should be made with regard to the characteristics of ICT infrastructure: where monopolistic or oligopolistic arrangements still exist, prices tend to be fixed and do not favour the use of new technologies (especially connections to the Internet ) and thus negatively influence users’ attitude towards IT. On the contrary, countries with a higher degree of telecommunication market liberalisation allow for greater competition and thus for lower prices, favouring a higher level of technological penetration. In this respect, northern European countries are much more advanced than southern ones.
Quantitative development of supply
As far as the quantitative development of supply is concerned, the European supply in multimedia educational products is still limited by a number of factors:
- The market is seldom considered as profitable in the short term and therefore the perceived risks of expanding production are quite high;
- The sales for the home market are mainly based on a low number of titles;
- The supply is sizeable only in four countries (United Kingdom, Germany, France and to a lesser extent Spain);
- Lack of equipment.
In general terms, the quantitative development of supply is high in countries such as France, the UK, the US, Canada and Australia; Nordic countries show a medium level of development (relatively high coverage, not many products), whereas countries such as Greece, Portugal and Hungary show a low level of development (low content coverage, not many products). In countries where the level of development is low, prices are still high and the volume of sales is low. The producers’ response to such a situation generally consists in aggressive advertising campaigns and price discounting of new releases for products addressed to the home market, and in focussing the attention on high quality when addressing to specific categories of buyers (mainly belonging to the training and to the education sector).
Main features of Multimedia Supply
|
Estimated number of publishers |
Estimated number of products available |
Average turnover |
|
| Belgium | 25 |
89* |
n.a. |
| France | 220 |
2,500 |
<0.35** |
| Germany | 190 |
1,300° |
0.6** |
| Greece | 25 |
247* |
0.6** |
| Italy | 80 |
700* |
<0.35** |
| Portugal | 35 |
332* |
N/A. |
| Spain | 100 |
1,800 |
0.6** |
| United Kingdom | 300 |
5,000 |
2.5 |
Source: BASE Survey 1998, Meso Report 1998
As for the products boosting the electronic publishing sector, southern European users tend to prefer games and reference tools, whereas northern European ones mainly request education and training software.
However, it should be pinpointed that publishers all over Europe still claim a substantial organisational lack as far as the distribution of multimedia products is concerned, and therefore prefer, in most of the cases, to either undertake special agreements with local distributors or to use their own distribution networks.
Use of ICT in education and training
In the framework of the issue use of ICT in education and training, the development trend of the three sectors education, home and training has been analysed.
The education sector has not been viewed until now as a very profitable one and has been generally considered as being too difficult to enter. The lack of adequate financial support is one of the most serious obstacles in entering this sector. Yet, especially in France, Spain Italy and the United Kingdom new avenues seem to be opening as a number of recent national policies have set emphasis on the introduction of programmes for educational multimedia. Thus, the educational sector is undergoing significant changes, and perceptions on its potential expansion are becoming increasingly positive.
The following two tables present respectively European countries’ expenditure in education and the level of technological penetration in the school sector.
Technological penetration in the school sector
|
Number of pupils/students* |
Number of teachers* |
Number of schools* |
Number of students per PC in schools |
Number of computers connected to the Internet in educational centres, % 1997** |
|
| Austria | 1,500,000 |
144,000 |
10,013 |
19.4 |
57 |
| Belgium§ | 324,935 |
82,780 |
n.a. |
n.a. |
n.a. |
| Denmark | 1,081,492 |
149,532 |
n.a. |
n.a. |
n.a. |
| France | 12,160,000 |
848,000 |
n.a. |
21.4 |
49 |
| Germany | 14,306,400 |
577,059 |
38,727 |
20.3 |
58 |
| Greece | 1,597,595 |
126,771 |
15,957 |
n.a. |
n.a. |
| Italy | 9,080,000 |
836,000 |
37,771 |
42.4 |
47 |
| Spain | 9,250,000 |
480,000 |
n.a. |
41.2 |
45 |
| Sweden | 1,916,733 |
116,678 |
5,577# |
7.8 |
60 |
| United Kingdom | 10,060,000 |
628,000 |
29,554 |
8.1 |
58 |
Source: Meso elaboration of data from different sources: Dataquest, Eurydice, Statistisches Bundesamt: Statistisches Jahrbuch 1997, Bonn; Multimedia Liste 1998
* The data collected refer to the year 1996 and 1997, depending on the source and the information available for the different countries.
** The data collected are available only for some of the countries analysed
§ data on French Community
# including Primary and Secondary schools
As for the Training sector, training and re-training programmes for employers and employees have become increasingly important in the European corporate sector. Companies are placing great emphasis on multimedia training since they present two significant advantages: they allow to save resources on traditional training and they allow a quick adaptation of skills to the market changing needs. At present, corporate training is most needed in technical IT skills and this means that there is a great potential for multimedia training and education. The latter is viewed as having the ability to deliver high quality, highly focused and detailed training and education materials across a wide geographical area (Datamonitor, 19, 1997). The leading industries are banking, retail and petro-chemical thus mainly large organisations, but several developments are taking place in smaller enterprises, through the implication of intermediaries (association, Chamber of Commerce, etc.) in the training provision and funding system. Training and re-training programmes are experiencing a growing demand all over Europe, especially in Northern European countries. The following table represents the level of IT penetration in the training sector.
IT penetration in the training sector
|
Country |
Number of Business PCs per 100 |
| Austria | 50 |
| Belgium/Lux. | 51 |
| Denmark | 64 |
| France | 56 |
| Germany | 44 |
| Greece | 36 |
| Italy | 44 |
| Norway | 91 |
| Portugal | 34 |
| Spain | 48 |
| Sweden | 75 |
| Switzerland | 76 |
| United Kingdom | 55 |
| US | 103 |
| Japan | 18 |
Source: EITO 1998
As it can be noticed, Europe has an average of 52 computers per 100 White collar workers, whereas the US value is double. It is clear that Europe still has a long way to go in order to reach a comparable level of technological infrastructure in this sector, though figures for some European countries (Norway, Sweden, Switzerland) can be considered satisfactory.
With regard to the Home sector, it has boosted the market development of educational CD-ROMs and on-line services in many European countries, especially in those with a high degree of technological penetration. Countries with a more developed Internet infrastructure and lower access costs have shown a greater demand for Web-based services , although compared to off-line products these have experienced a much lower demand. It should be noted that the consumer market is the largest user segment of multimedia since the majority of PCs are sold to home users.
In the overall, games and edutainment products are the most sold, though an increasing trend is to be noticed as for the education product. Three are the main factors which have contributed to the increasing demand for educational multimedia products :
- Higher quality of products;
- Declining costs of multimedia hardware and software;
- Government initiatives promoting the use of multimedia tools in schools.
Moreover, children and students approaching multimedia opportunities at school become more interested in further exploring them at home as well.
In short, and according to the data collected, there is a substantial optimism concerning the growth of multimedia products and services for education in Europe. As a matter of fact, the total expenditure in this sector is expected to grow due to declining prices and/or higher quality products. Nevertheless, the CD-ROM market will continue to hold the largest share of the home education sector; in fact, although the number of Internet users is expected to grow at a faster rate than the CD-ROM users, off-line products will continue to hold a greater share of the home educational market, due to lower prices, greater accessibility and availability of products. However, the growth in the demand of on-line products and services will be highly affected by the supply conditions, with particular reference to the liberalisation of the telecommunication market, especially with regard to southern European countries.
Market mechanisms have also been considered in order to assess the qualitative degree of market development on the basis of four indicators:
- availability of information on supply, particularly consolidated in countries such as France and the UK and, to a lesser extent, Germany. By the way, on the overall Europe does not show a satisfactory level of development, since the remaining countries (especially southern European ones) do not show an established network of information sources.
- reference market prices: with regard to this issue, the UK, France and some Nordic countries such as Denmark show an incipient market maturity, since reference price plans classified by typology of products are emerging. Prices for multimedia products are diminishing in southern European countries due to a higher degree of market liberalisation, to the increase in the number of competitors and to a higher degree of professionalism among providers. The observed generalised trend towards a reduction of prices makes the possibility of moving from a low volume /high price to a high volume/low price situation more plausible, especially in the United Kingdom, which could pave the way for the development of similar trends in the rest of Europe.
- Import-export activities: Europe continues to run a trade deficit in IT and telecommunication products. in the overall, European countries still have great problems in competing with non EU countries such as the US, Canada and Australia, with the exception of the United Kingdom, France and Spain which export their products to countries of their language area by-passing the linguistic and cultural adaptation problem.
- Distribution channels vary according to the market publishers are addressing to: either direct sales or mail order when dealing with large companies or SMEs, bookstores and software- or hyper markets when addressing to the home market and distributors or bookstores for the distribution of educational products. especially in this sector an unsatisfactory organisation of distribution is claimed by publishers who therefore prefer to use their own distribution network.
Synthesis
All the elements emerging from the considerations made above are summarised in the following table, which is intended to represent the degree of multimedia market development in Europe, in comparison with some representatives non European countries.
Synthesis of market development factors
|
Penetration of technology |
Quantitative development of supply |
Use of ICT in |
Market mechanisms at work (info, prices, etc.) |
Overall |
|
|
Australia |
High |
High |
High |
Yes |
H |
|
Canada |
High |
High |
Medium/High |
Yes |
H |
|
Denmark |
High |
Low |
High |
Yes |
H |
|
France |
Medium/High |
High |
Medium |
Yes |
M -> H |
|
Germany |
Medium/High |
High |
Low/Medium |
Yes |
M -> H |
|
Greece |
Low |
Very Low |
Low |
No |
L -> M |
|
Hungary |
Low |
Very Low |
Low |
No |
L -> M |
|
Ireland |
Medium/High |
Medium/High |
High |
Yes |
M -> H |
|
Italy |
Medium |
Medium |
Low |
Yes (starting) |
M |
|
Japan |
Low |
Medium |
Low |
n.a. |
L -> M |
|
Norway |
High |
High |
High |
Yes |
H |
|
Portugal |
Low |
Very Low |
Low |
No |
L -> M |
|
Spain |
Medium/Low |
Medium/High |
Low |
Yes (starting) |
M |
|
Sweden |
High |
High |
High |
Yes |
H |
|
United Kingdom |
High |
High |
High |
Yes |
H |
|
USA |
High |
High |
High |
Yes |
H |
Source: MESO Report 1998